Figures & data
Table 1 Statistical Values of Refractive Errors and Corneal Parameters
Table 2 Comparison of Patients’ Data Between Two Age Groups
Table 3 Comparison Between Data of Males and Females
Table 4 Correlation Value Between Different Parameters
Figure 1 Correlation between spherical equivalent in absolute value and average K showing a statistically significant but weak positive correlation (r = 0.136, p-value <0.001).
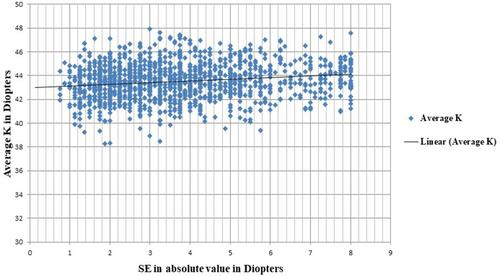
Figure 2 Correlation between average k and central corneal thickness showing a statistically significant but weak negative correlation (r = −0.089, p-value = 0.001).
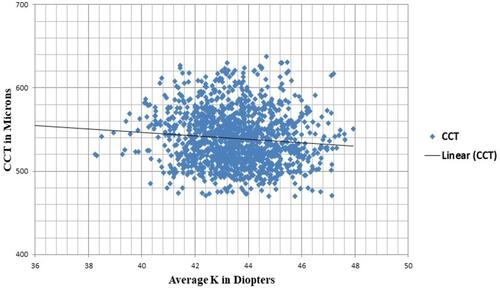
Figure 3 Correlation between absolute value of keratometric and refractive astigmatism showing a statistically significant strong positive correlation (r = 0.651, p-value <0.001).
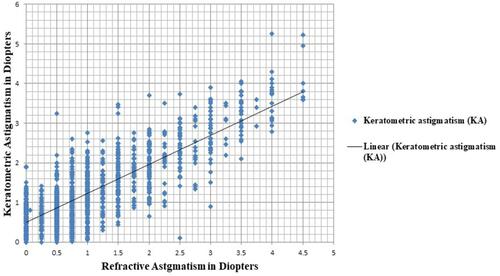
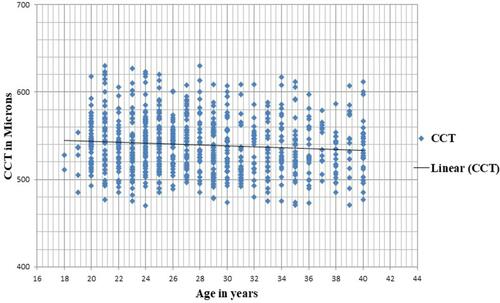
Figure 4 Correlation between age and central corneal thickness showing a statistically significant but weak negative correlation (r = −0.094, p-value <0.001).