Figures & data
Table 1 Postoperative Parameters Compared to the Preoperative Ones at Each Time Point in Both Groups
Table 2 Comparison of the BCVA, Refractive Errors, ACD, ECC, and CCT Between Both Groups at Each Postoperative Visit
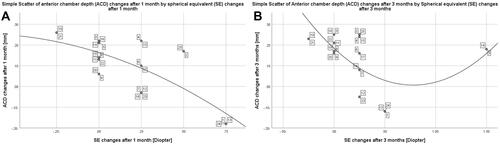
Figure 1 Scatter plots showing a significant negative quadratic correlation between the changes in the ACD and the changes in the spherical equivalent during the 1st month (R= −0.6, P=0.001, A), and 3rd month (R= −0.4, P=0.04, B) postoperatively in the FECD group. Case numbers are displayed with connecting lines to each corresponding data value.