
Figures & data
Table 1 Demographics and Baseline Characteristics of Our Cohort of 20 Individuals
Figure 1 Duration of mycophenolate mofetil treatment for 20 patients.
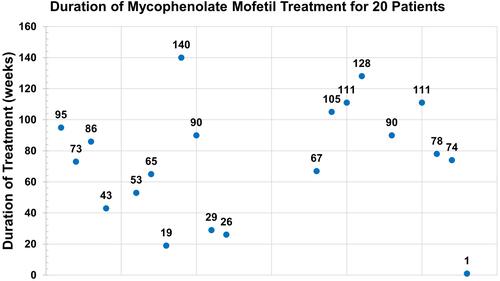
Figure 2 Flowchart demonstrating the treatments received by individuals with moderate-severe TED and those with DON at baseline, 24 weeks, 52 weeks and 78 weeks.
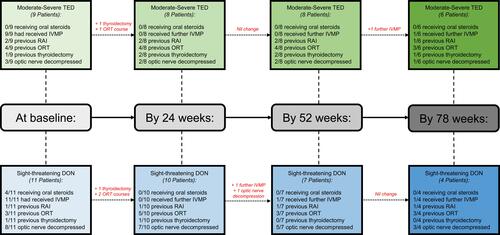
Table 2 Ophthalmic Assessments for Individuals with Moderate-Severe TED and Sight-Threatening DON at Baseline, 24 Weeks, 52 Weeks, 78 Weeks
Table 3 Ophthalmic Responses for Individuals with Moderate-Severe TED and Individuals with Sight-Threatening DON at 24 Weeks, 52 Weeks, 78 Weeks vs Baseline
Table 4 Relapses in Those with Moderate-Severe TED and Sight-Threatening DON Occurring by 24 Weeks, 52 Weeks, 78 Weeks
Table 5 Side Effects During Mycophenolate Mofetil Treatment for Our Cohort