Figures & data
Figure 1 Dosage and injection sites of botulinum toxin (Image courtesy of Supanut Apinyawasisuk, MD).
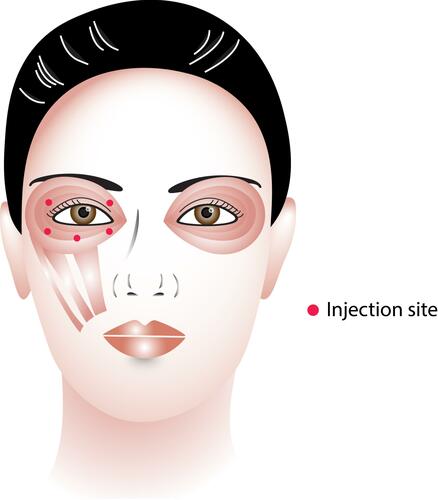
Table 1 Baseline Demographics and Clinical Characteristics
Table 2 Comparison of Prevalence and Clinical Parameters Between Affected Eyes (Homolateral Eye) and Non-Affected Eyes (Contralateral Eye) at Baseline
Table 3 Comparison of Fluorescein Clearance Test (FCT) Between FCT at Baseline and FCT at 1 Month After BTX-A Injection in Homolateral and Contralateral Eye
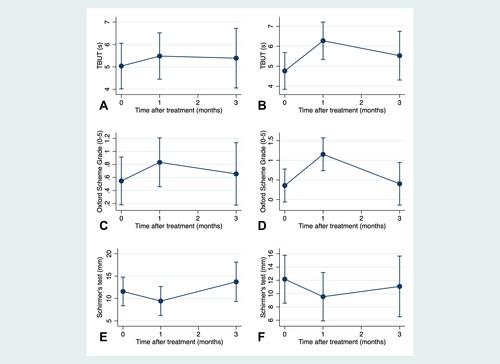
Figure 2 Dry eye parameters at baseline, 1-month, and 3-month after injection of botulinum toxin type A in homolateral and contralateral eyes: (A) tear break-up time of homolateral eyes; (B) tear break-up time of contralateral eyes; (C) Oxford scheme grade of homolateral eyes; (D) Oxford scheme grade of contralateral eyes; (E) Schirmer’s test of homolateral eyes; (F) Schirmer’s test of contralateral eyes.