
Figures & data
Figure 1 Pre-LRS Orbscan map of case 1. Right bottom shows a pachymetric map: an example of measuring the differences in thickness between symmetrically opposed points is shown on the pachymetric map (0–180°, 45–225°, 90–270°, and 135–315°): 0–180°: 39 µm; 45–225°: 44 µm; 90–270°: 33 µm; 135–315°: 3 µm; total: 119 µm. Right top map: Measuring the distance between the maximum posterior elevation (best-fit-sphere; BFS) and the visual axis. Corneal apex: temporally deviated (right upper red circle). The thinnest point (X, Y) is indicated by the lower red square, and the posterior high on thicker cornea, and front elevation on the thinner cornea is also shown.
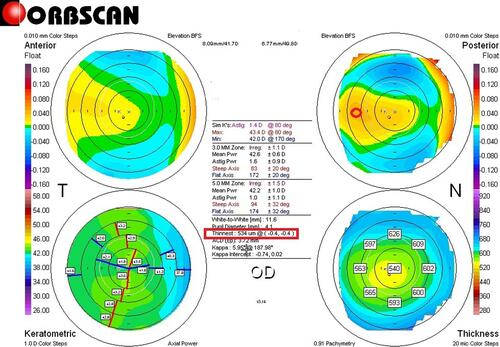
Figure 2 Pre-E-LAK-SCAP (post-LRS) Orbscan map of case 1. Right bottom pachymetric map: an example of measuring the differences in thickness between symmetrically opposed points is shown on the pachymetric map (0–180°, 45–225°, 90–270°, and 135–315°): 0–180°: 60 µm; 45–225°: 60 µm; 90–270°: 21 µm; 135–315°: 6 µm; total: 147 µm. Right top map: shows the measured distance between the maximum posterior elevation (best-fit-sphere; BFS) and the visual axis. Corneal apex: temporally deviated (right upper red circle). The thinnest point (X, Y) is indicated by the lower red square.
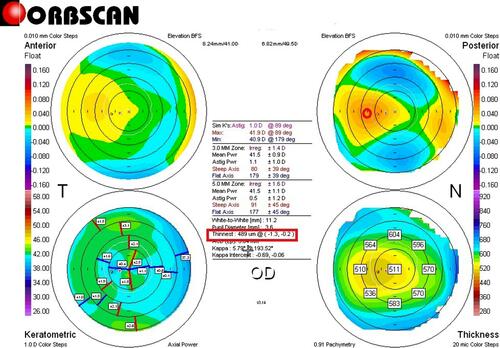
Figure 3 Post-E-LAK-SCAP Orbscan map of case 1. Right bottom pachymetric map: an example of measuring the differences in thickness between symmetrically opposed points is shown on the pachymetric map (0–180°, 45–225°, 90–270°, and 135–315°. 0–180°: 4 µm, 45–225°: 5 µm, 90–270°: 28 µm, 135–315°: 41 µm, total: 78 µm). Right upper map: the measured distance between the maximum posterior elevation (best-fit-sphere; BFS) and the visual axis is also shown. Corneal apex: centrally located (right upper red circle). The thinnest point (X, Y) is indicated by the lower red square.
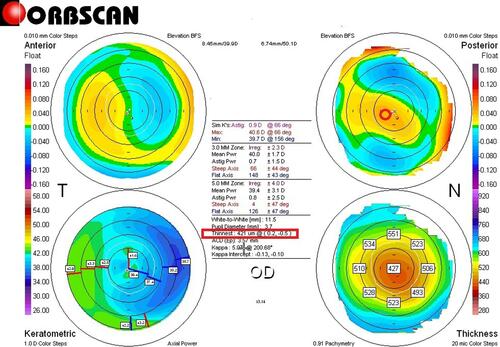
Figure 4 The schematic description of LAK-SCAP. (A) shows examples of axial, symmetric images of two-partial ablation patterns. (B) shows examples of laser ablation patterns for LAK-SCAP; specifically, it shows one partial ablation for existing cylindrical ablation patterns, as seen in (A). These patterns can be achieved by blocking laser corneal ablations at the thinner sections of the cornea.
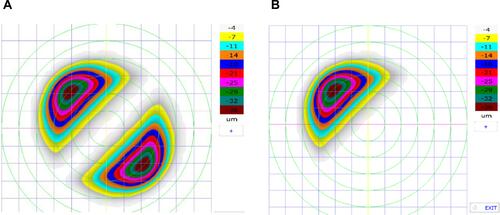
Figure 5 Ablation pattern of case 1: Purple circled round area indicates ablation pattern (total =5.50 diopters) of both refractive error (−4.0 diopters) and myopic shift (−1.50 diopters) due to LAK-SCAP, and red dotted circled area indicates LAK-SCAP on the thicker area of the cornea.
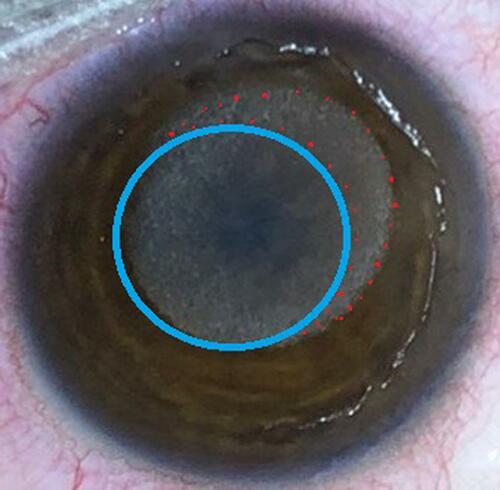
Figure 6 Differential pachymetric map by Orbscan II (Bausch & Lomb, Bridgewater, NJ, USA) between pre- and post-E-LAK-SCAP in case 1.
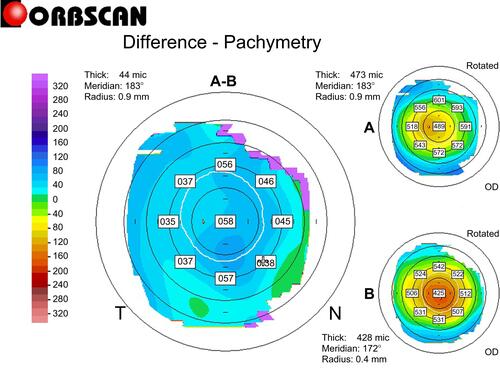
Table 1 Patients Findings
Table 2 Intraoperative Findings
Table 3 Pre- and Postoperative Findings of LRS and E-LAK-SCAP