
Figures & data
Figure 1 Representative gonioscope GS-1 images with PAS formation after µLOT in a 360-degree view of the angle, and the distribution of the average PAS formation rate in each angle position.
Notes: (A) The typical merged GS-1 image after µLOT displayed in a 360-degree view of the angle is shown on the right side, in which the ocular features are seen as in direct gonioscopy, with the extent of the incision indicated in red. Each PAS formation is indicated by a white arrow. The image shows the left eye of a patient with primary open-angle glaucoma, for whom five gonio-images show the extent of the PAS within the incision. In addition, a GS-1 image of the extent of the incision, in which PAS is present, is shown on the left. (B) The radar chart shows the distribution of the average PAS formation rates in each sector. PAS appears to form frequently in the incision.
Abbreviations: PAS, peripheral anterior synechia; µLOT, microhook ab interno trabeculotomy; S, superior; SST, superior-superior-temporal; ST, superior-temporal; STT, superior-temporal-temporal; T, temporal; ITT, inferior-temporal-temporal; IT, inferior-temporal; IIT, inferior-inferior-temporal; I, inferior; IIN, inferior-inferior-nasal; IN, inferior-nasal; INN, inferior-nasal-nasal; N, nasal; SNN, superior-nasal-nasal; SN, superior-nasal; SSN, superior-superior-nasal.
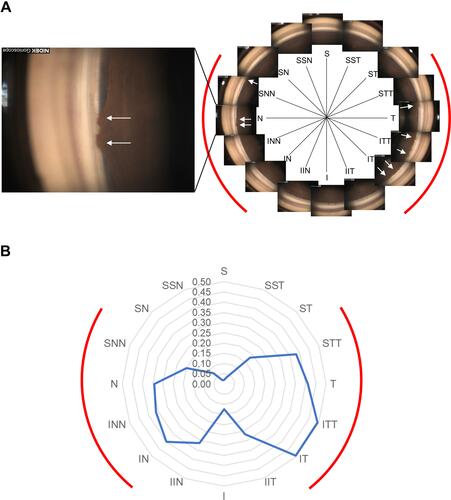
Table 1 Continuous Preoperative and Postoperative Variables
Table 2 PAS Formation Frequencies and Rates After µlot Classified by Categorical Variables in Demographic Data
Table 3 Possible Associations Among PAS Rates and Various Continuous Variables Analyzed by the Simple Linear Regression Model
Table 4 Possible Associations Among PAS Rate and Various Variables Analyzed by the Mixed-Effect Model