
Figures & data
Table 1 Sociodemographic and Clinical Characteristics at Baseline
Table 2 Results of Repeated-Measures ANOVA on the Dependent Variables (n = 156)
Figure 1 Change in OSDI scores.
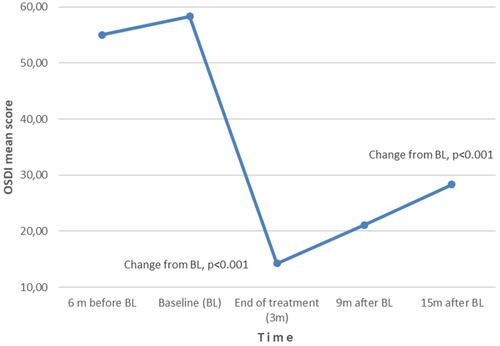
Figure 2 Change in NIBUT.
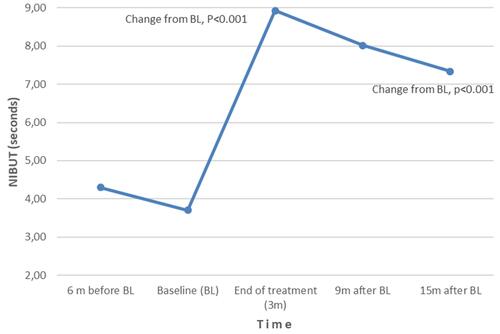
Figure 3 Change in osmolarity.
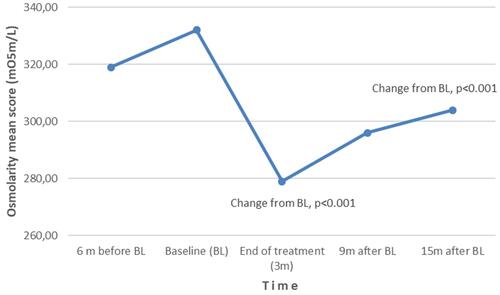
Figure 4 Change in meniscal height.
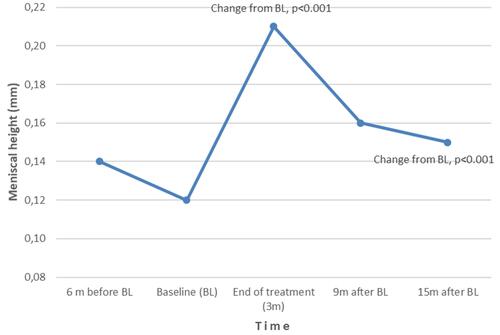
Table 3 Pearson’s Correlations Between the Dependent Variables (n = 156)
Table 4 Multiple Linear Regression Models Predicting Change in the OSDI (n = 156)