Figures & data
Table 1 Patient demographics and baseline characteristics
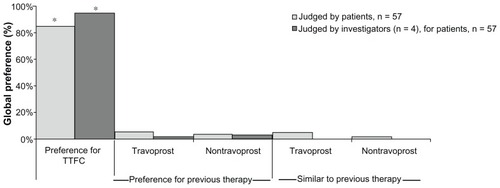
Figure 1 Mean IOP across visits by patient cohort.
**P < 0.0001, baseline versus week 4 or week 12, as measured by ANOVA.
Notes: 57 Patients attended the week 12 visit (37 from the prior travoprost cohort and 20 from the prior nontravoprost cohort). Data from the other seven patients were carried forward from week 4 to week 12. Error bars are shown unidirectional for clarity. *P = 0.0001, baseline versus week 4 or week 12, as measured by ANOVA.
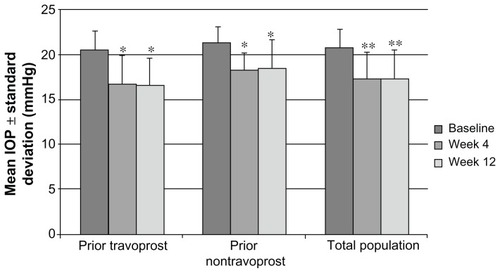
Figure 2 Percentage of patients reaching target IOP across visits by patient cohort.
Notes: 57 Patients attended the week 12 visit (37 from the previous travoprost cohort and 20 from the previous nontravoprost cohort). Data from the other seven patients were carried forward from week 4 to week 12.
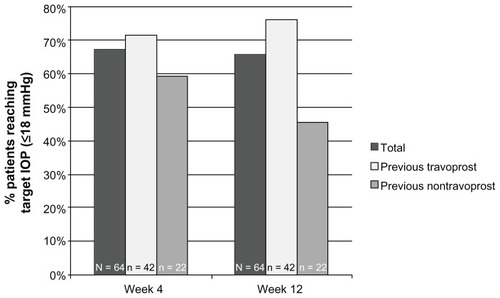
Figure 3 Percentage of patients achieving ≥2 mmHg reductions in IOP across visits by patient cohort.
Notes: 57 Patients attended the week 12 visit (37 from the previous travoprost cohort and 20 from the previous nontravoprost cohort). Data from the other seven patients were carried forward from week 4 to week 12.
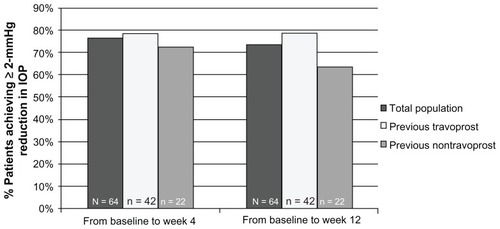
Table 2 Adverse events of all enrolled patients (N = 65)
Table 3 Survey results, with ocular symptoms at week 12 sorted from lowest to highest incidence
Figure 4 Global preference survey.
Note: *P < 0.0001, preference for TTFC vs preference for or similar to previous therapy, both for patients and investigators.