
Figures & data
Figure 1 Patient inclusion and exclusion in two arms (SNL and control groups).
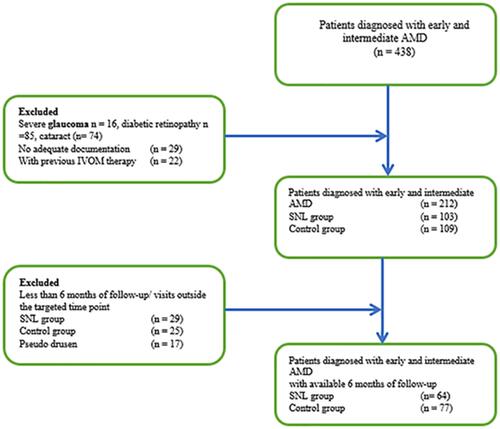
Figure 2 Fundus photograph showing the macular morphological features 6 months after using SNL therapy.
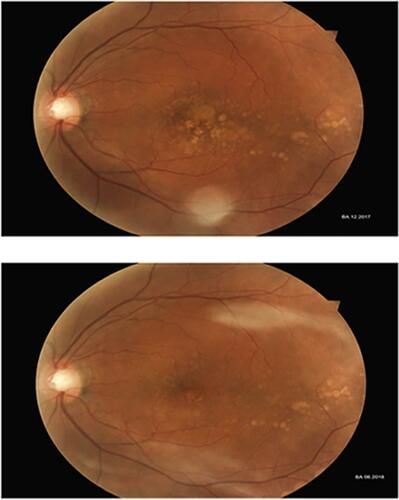
Table 1 Representation of Baseline Characteristics for Patients Enrolled (SNL and Control Group)
Figure 3 The drusen number in the control group at baseline was 37.3±21.1 (range=82.6–88), and after 6 months follow-up, the number was 43.6±24.5 (range=81.9–90, p <0.001, 95% CI=36.9–50.3). In the SNL group, the drusen number at baseline was 29.4±19.2 (range=71.3–74), and after 6 months it was 24.7±14.8 (range=58.1–59, p<0.001, 95% CI=20.6–28.7).
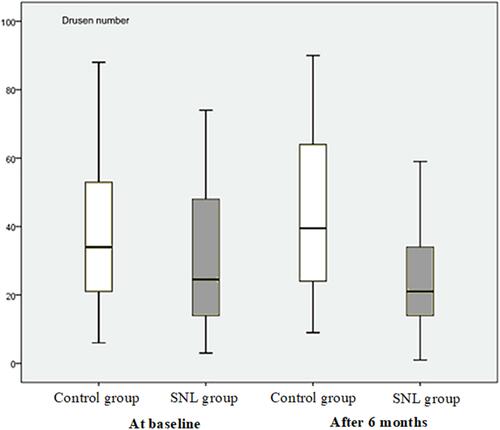
Figure 4 The drusen size (µm) in the control group at baseline was 40.6±20.3 (range=80.7, 12.4–93.1), after 6 months it was 49.3±28.4 (range=105.5, 11–116.5, p<0.001, 95% CI=39.4–59.2). In the SNL group, the drusen size (µm) at baseline was 59.9±44.8 (range=163.9, 7.1–171), and after 6 months it was 48.9±34.4 (range=121, 4.8–125.8, p <0.001, 95% CI=36.9–61).
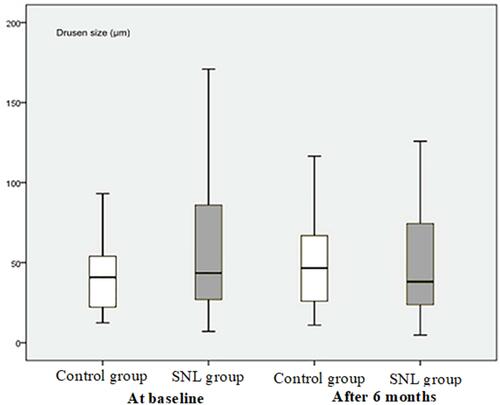
Table 2 Measurement of Secondary Outcome Variables Geographic Atrophy and Choroidal New Vessels