Figures & data
Table 1 Overview of the MicroShunt Device Surgical Procedure Recommended by the Manufacturer
Figure 1 Overview of the main steps of the new surgical technique. (A) The needle is aimed to pierce the sclera starting 3 mm from the limbus. (B) Once the needle has reached the limbus it is pushed downwards. (C) The needle goes into the anterior chamber. (D) Once the tunnel is created with the triangular blade, the path of the needle used to enter the anterior chamber may be not perfectly coaxial with the tunnel, thus creating a false passage.
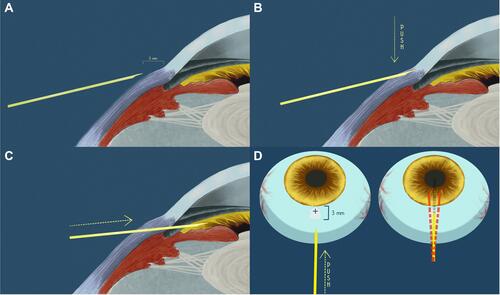
Table 2 Main Demographic and Clinical Characteristics of the Study Population
Figure 2 Median intraocular pressure over the course of the study follow-up. Vertical bars represent interquartile range. *p < 0.005 as compared to baseline (Friedman test and post hoc analysis for pairwise comparisons were done with the Conover method).
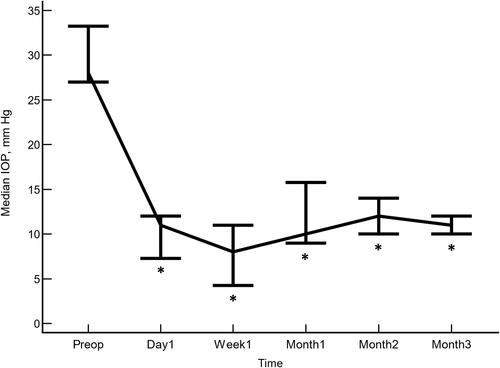
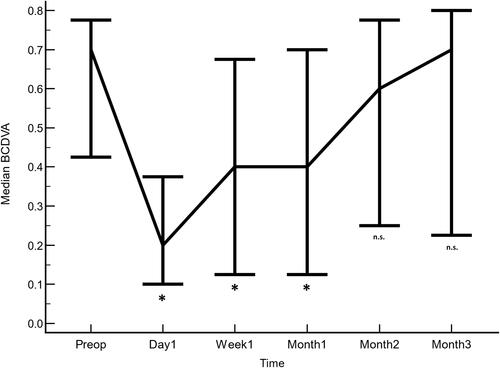
Figure 3 Overview of the median best corrected distance visual acuity (BCDVA) over the course of the study follow-up. Vertical bars represent interquartile range. *p < 0.01 as compared to baseline (Friedman test and post hoc analysis for pairwise comparisons were done with the Conover method).