
Figures & data
Table 1 Demographic Data, Corrected Distance Visual Acuity (CDVA), and Refractive Spherical Equivalent for the 2 Studied Groups
Table 2 Medians, Interquartile Ranges (IQR), Minimum (Min) and Maximum (Max) Values of the Various Pentacam HR Indices for the 2 Studied Groups, and P values of Significance Between the 2 Groups
Figure 1 Boxplot of some curvature Pentacam-HR indices values in group 1 corneas before and 1month after the Soft Contact Lens (SCL) discontinuation period. (A) K max: Maximum keratometry, (B) K mean: Mean keratometry, (C) ISV: index of surface variance.
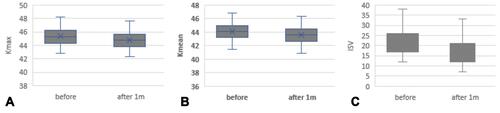
Figure 2 Boxplot of some elevation and pachymetric Pentacam-HR indices values in group 1 corneas before and 1month after the Soft Contact Lens (SCL) discontinuation period. (A) AE from BFS: anterior elevation from the best-fit sphere, (B) PE from BFS: posterior elevation from the best-fit sphere, (C) PPI avg: average corneal pachymetry progression index, (D) PPI max: maximum corneal pachymetry progression index.
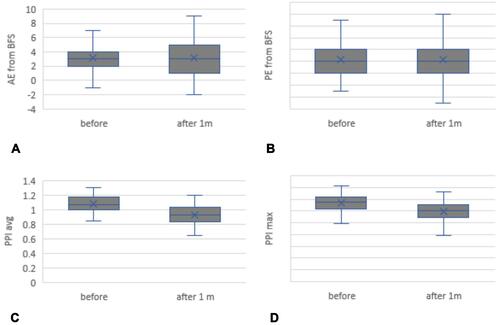
Table 3 Medians, Interquartile Ranges (IQR), and Comparisons of Various Pentacam HR Indices in Group 1 Before and After Soft Contact Lens (SCL) Discontinuation