Figures & data
Table 1 Basic Parameters of the Analyzed Subjects
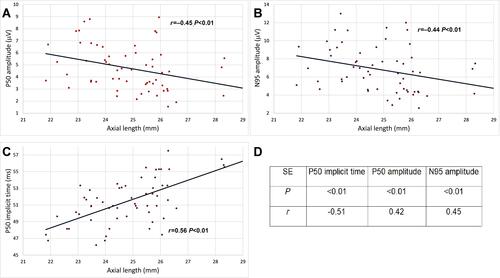
Figure 1 PERG-traces representative for individuals of the particular group.
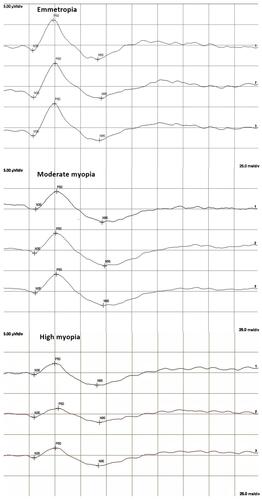
Table 2 Parameters Measured in Analyzed Groups
Figure 2 (A) Correlation of P50 amplitude and AL. (B) Correlation of N95 amplitude and AL. (C) Correlation of P50 implicit time and AL, (D) Correlation between spherical equivalent of refractive error and P50 and N95 amplitude and P50 implicit time.
Abbreviations: AL, axial length; SE, spherical equivalent of refractive error; P, level of significance; r, coefficient of correlation.