Figures & data
Figure 1 Design and characteristic features of the version 1 and version 2 test IOLs and the control IOL (A) and photographic comparison of frosted (left) and unfrosted (right) haptics at high magnification (B).
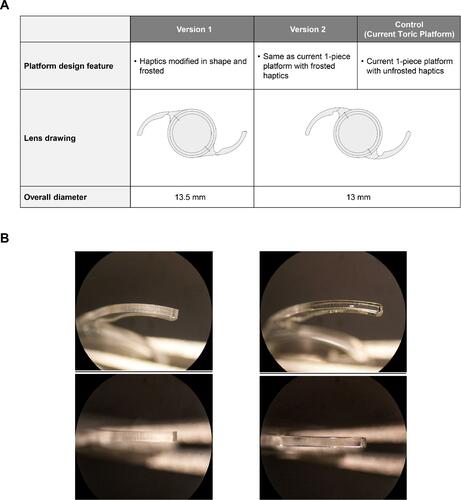
Table 1 Participant Demographics at Baseline
Table 2 Disposition of Eyes Included in the IOL Rotational Analysis by Time Point for Version 1, Version 2, and Control
Figure 2 Bland-Altman plot showing the average of month 1 and month 6 signed orientation versus difference between these time points (month 6 minus month 1 orientation), by IOL. Mean difference and 95% limits of agreement are shown for test and control IOLs combined. Negative values indicate a clockwise difference in orientation between month 1 and month 6 time points.
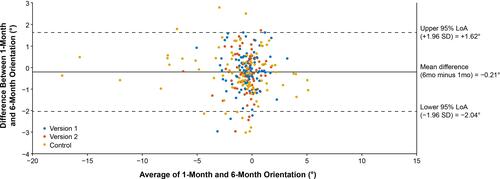
Table 3 Comparisons of Mean Absolute IOL Rotations for Version 2 versus Control at Postoperative Day 1, Week 1, Month 1, and Month 6
Table 4 Comparisons of Mean Absolute IOL Rotations for Version 1 versus Control at Postoperative Day 1, Week 1, Month 1, and Month 6
Figure 3 Boxplot of absolute IOL rotation from operative to postoperative week 1 (A), postoperative month 1 (B), and postoperative month 6 (C).
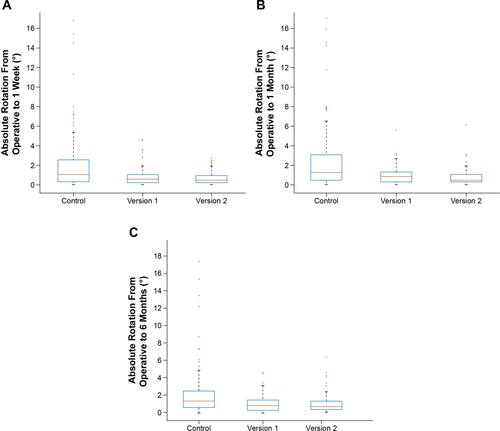
Table 5 Comparisons of Mean Absolute IOL Rotations for Version 1 versus Version 2 at Postoperative Day 1, Week 1, Month 1, and Month 6
Figure 4 Mean signed IOL rotation from operative to postoperative day 1, week 1, month 1, and month 6 for the version 1, version 2, and control IOLs. Negative values indicate clockwise rotation, as observed from a slit lamp. Error bars represent 95% CIs of the mean values.
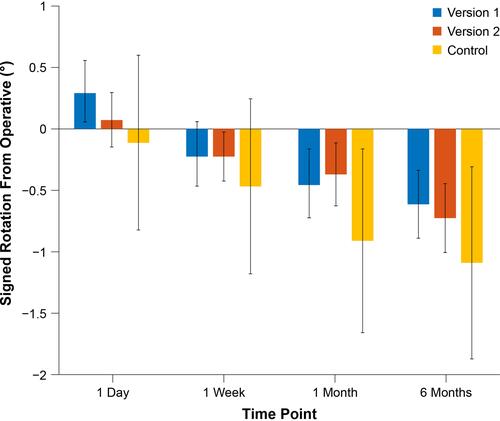
Figure 5 Scatterplots of signed IOL rotation at postoperative day 1 versus week 1 (A), postoperative day 1 versus month 1 (B), and postoperative day 1 versus month 6 (C).
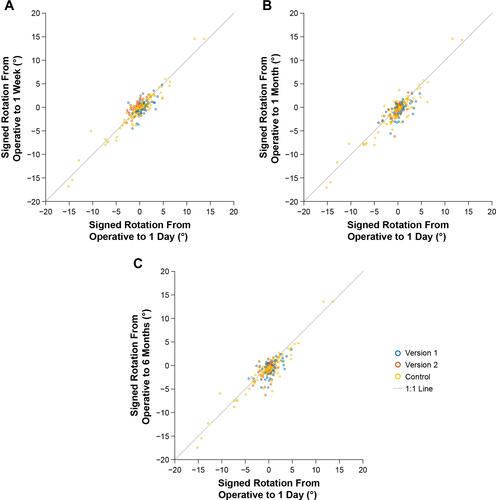
Figure 6 Scatterplot of absolute IOL rotation at postoperative week 1 versus axial length for the version 1, version 2, and control IOLs.
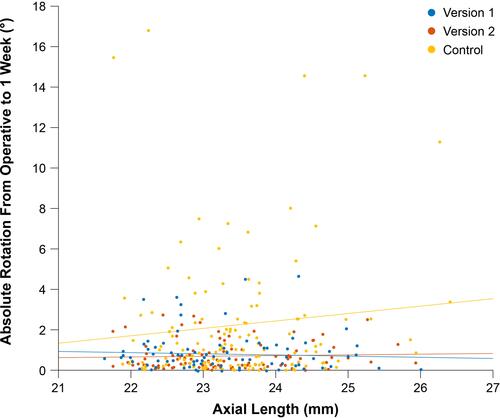
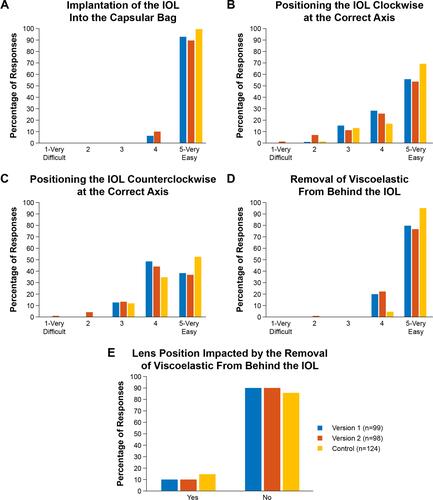
Figure 7 Surgeon responses to the operative questionnaire on ease of IOL handling during implantation for the version 1, version 2, and control IOLs. The operative questionnaire comprised questions on the following: ease of implantation of the IOL into the capsular bag (A); ease of positioning the IOL clockwise at the correct axis (B); ease of positioning the IOL counterclockwise at the correct axis (C); ease of removal of viscoelastic from behind the IOL (D); and whether or not the lens position was impacted by the removal of viscoelastic from behind the IOL (E).