
Figures & data
Figure 1 Scatter plot showing distribution of the refractive error (absolute value of the difference between the spherical equivalent values of the intended and final refractions) between eyes filled with BSS, air and gas.
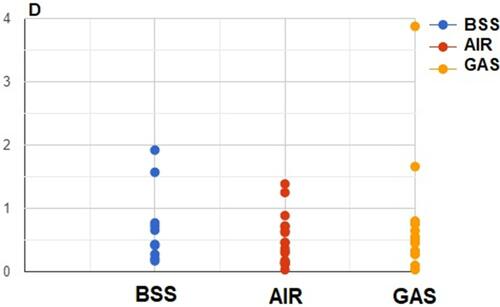
Table 1 Comparison of Baseline Characteristics, SE Difference and ACD Between Groups with Different Vitreous Filling in Phacovitrectomy