Figures & data
Table 1 Patient and Ocular Characteristics
Table 2 Comparison of logMAR Visual Acuity Scores
Figure 1 Scatterplot of Office versus Home Visual Acuity.
Notes: Visual acuity measured in the office and at home, with the line of equality; Points have been jittered to help with visualization.
Abbreviations: VA, visual acuity; logMAR, logarithm of the Minimal Angle of Resolution.
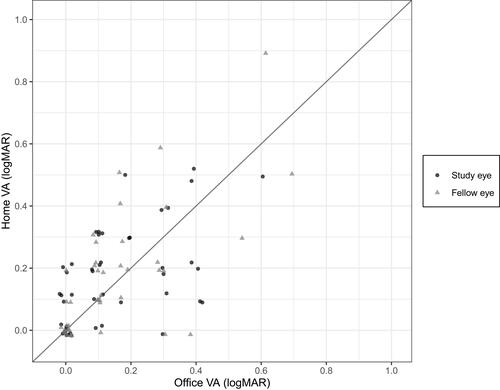
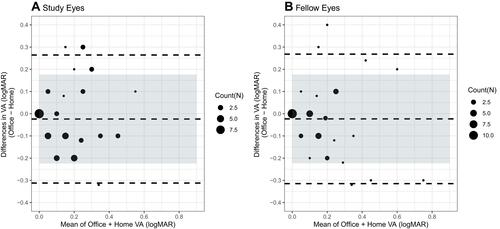
Figure 2 Bland-Altman Plot of Office versus Home Visual Acuity.
Notes: Bland-Altman plots of the difference between office and home visual acuity (VA) assessments versus the mean of office and home VA assessments for (A) Study eyes (N=45) and (B) Fellow eyes (N=42). The dashed center line indicates the mean difference and the dashed upper and lower lines indicate the 95% limits of agreement. Shaded regions represent the clinically acceptable limits of agreement, ± 0.2 logMAR from the mean difference. Counts demonstrate number of eyes at each point.
Abbreviations: N, number; logMAR, logarithm of the Minimal Angle of Resolution.