Figures & data
Table 1 Demographics and Baseline Preoperative Parameters of Both Groups
Table 2 Visual and Refractive Outcomes of Both Groups at 12 Months
Figure 1 Difference map (12 months preop) showing 12 months outcome of a patient who underwent cross linking treatment using Flavin riboflavin dye.
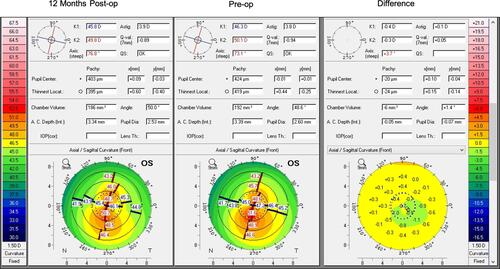
Figure 2 Difference map (12 months preop) showing 12 months outcome of a patient who underwent cross linking treatment using Peschke-D riboflavin dye.
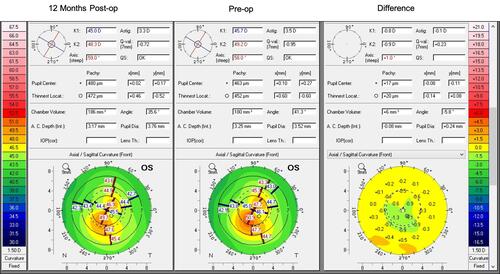
Table 3 Visual and Refractive Outcomes of Flavin Group Over 12 Months
Table 4 Visual and Refractive Outcomes of Peschke Group Over 12 Months
Table 5 Thinnest Pachymetry Changes of Both Groups at 12 Months
Figure 3 Histogram showing UDVA and CDVA of at 12 months postoperatively.
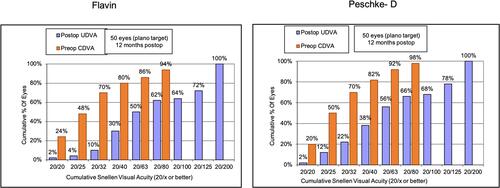
Figure 4 Histogram showing change in Snellen’s lines of CDVA.
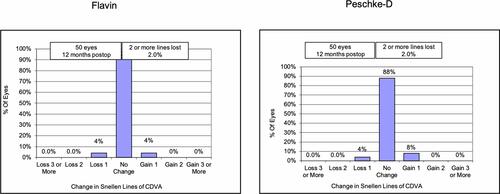
Figure 5 Histogram showing change in spherical equivalent refraction at 12 months postoperatively.
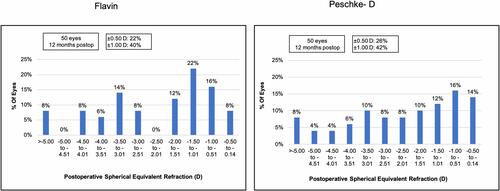
Figure 6 Histogram showing change in refractive astigmatism at 12 months postoperatively.

Figure 7 Histogram showing change in mean spherical equivalent at 1 month, 3 months, 6 months and 12 months postoperatively.
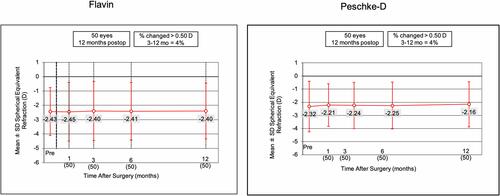
Figure 8 ASOCT image showing demarcation line depth at (A) 1-month and (B) 3-months postop for one eye each with Flavin and Peschke-D riboflavin dye.
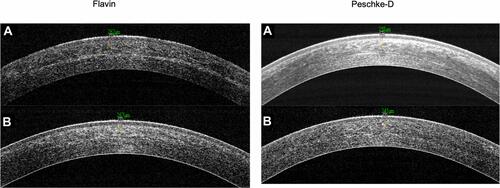
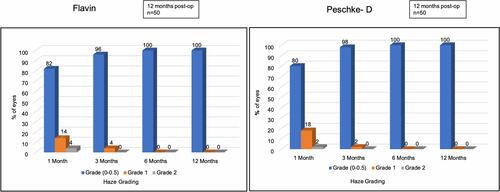
Figure 9 Histogram showing postoperative corneal haze grading.