
Figures & data
Table 1 Patients’ Characteristics
Table 2 Summary of the Eyes’ Demographic Data of the Anterior Pole for Visual Acuity Analyses
Figure 1 Graphs comparing the mean pre- and postoperative logMAR between uveitis and control groups. The pre- and postoperative best corrected visual acuity for distance converted to logMAR. The mean preoperative logMAR [0.44 ± 0.30, 95% confidence interval (CI): 0.33–0.55] was significantly decreased in the uveitis group than in the control group (0.18 ± 0.21, 95% CI: 0.11–0.26). The mean preoperative logMAR was significantly improved postoperatively at 1 and 3 months in both groups (1 month, control: −0.052 ± 0.13, 95% CI: −0.097–−0.0079; uveitis: 0.025 ± 0.075, 95% CI: −0.037−0.087; 3 months, control: −0.089 ± 0.090, 95% CI: −0.15–−0.029, uveitis: 0.0091 ± 0.13, 95% CI: −0.073–0.091). Error bars represent the standard error (SE). #P < 0.01; Student’s t-test or paired t-test.
![Figure 1 Graphs comparing the mean pre- and postoperative logMAR between uveitis and control groups. The pre- and postoperative best corrected visual acuity for distance converted to logMAR. The mean preoperative logMAR [0.44 ± 0.30, 95% confidence interval (CI): 0.33–0.55] was significantly decreased in the uveitis group than in the control group (0.18 ± 0.21, 95% CI: 0.11–0.26). The mean preoperative logMAR was significantly improved postoperatively at 1 and 3 months in both groups (1 month, control: −0.052 ± 0.13, 95% CI: −0.097–−0.0079; uveitis: 0.025 ± 0.075, 95% CI: −0.037−0.087; 3 months, control: −0.089 ± 0.090, 95% CI: −0.15–−0.029, uveitis: 0.0091 ± 0.13, 95% CI: −0.073–0.091). Error bars represent the standard error (SE). #P < 0.01; Student’s t-test or paired t-test.](/cms/asset/03033a7a-16f2-4872-b593-e688142be1ff/doph_a_12177386_f0001_b.jpg)
Figure 2 Comparison of the mean pre- and postoperative (A) photopic and (B) mesopic contrast visual acuity (CVA) and (C) the mean degree of improvement in CVA under photopic and mesopic conditions after cataract surgery between the uveitis and control groups. The pre- and postoperative contrast visual acuity for distance converted to logMAR. The mean preoperative 100% and 10% contrast visual acuities were decreased under photopic condition in the uveitis group (100% CVA: 0.55 ± 0.29, 95% CI: 0.41–0.68; 10% CVA: 0.98 ± 0.31, 95% CI: 0.83–1.12) compared to those in the control group (100% CVA: 0.39 ± 0.22, 95% CI: 0.31–0.47; 10% CVA: 0.74 ± 0.27, 95% CI: 0.65–0.83). The mean preoperative 10% CVA under mesopic conditions was significantly lower in the uveitis group than in the control group (control: 0.93 ± 0.26, 95% CI: 0.84–1.01; uveitis: 1.06 ± 0.25, 95% CI: 0.93–1.18), whereas the mean preoperative 100% CVA was not (uveitis: 0.57 ± 0.31, 95% CI: 0.43–0.72; control: 0.54 ± 0.25, 95% CI: 0.45–0.62). At 3 months postoperatively, the mean postoperative 100% and 10% CVAs were decreased under both photopic and mesopic conditions in the uveitis group (100% and 10% CVAs under photopic condition: 0.23 ± 0.19, 95% CI: 0.14–0.33 and 0.61 ± 0.27, 95% CI: 0.48–0.74, respectively; 100% and 10% CVAs under mesopic condition: 0.35 ± 0.22, 95% CI: 0.24–0.47 and 0.74 ± 0.21, 95% CI: 0.62–0.85, respectively) compared to those in the control group (100% and 10% CVAs under photopic condition: 0.034 ± 0.15, 95% CI: −0.012–0.086 and 0.29 ± 0.18, 95% CI: 0.22–0.35, respectively; 100% and 10% CVAs under mesopic condition: 0.18 ± 0.18, 95% CI: 0.12–0.24 and 0.53 ± 0.17, 95% CI: 0.47–0.59, respectively). (C) The mean degree of improvement in CVA was comparable between the uveitis (100% and 10% CVAs under photopic condition: under both photopic and mesopic conditions −0.36 ± 0.19, 95% CI: −0.46–0.25 and −0.41 ± 0.28, 95% CI: −0.67–−0.33, respectively; 100% and 10% CVAs under mesopic condition: −0.29 ± 0.20, 95% CI: −0.42–−0.19 and −0.37 ± 0.18, 95% CI: −0.51–−0.24, respectively) and control (100% and 10% CVAs under photopic condition: −0.36 ± 0.22, 95% CI: −0.43–−0.29 and −0.43 ± 0.31, 95% CI: −0.54–−0.32, respectively; 100% and 10% CVAs under mesopic condition: −0.35 ± 0.24, 95% CI: −0.42–−0.28 and −0.37 ± 0.28, 95% CI: −0.45–−0.29, respectively) groups. Error bars represent the standard deviation (SD). *P < 0.05, #P < 0.01; Student’s t-test or paired t-test.
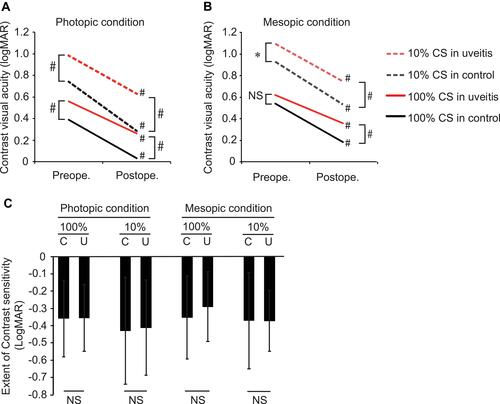
Figure 3 Comparison of aqueous flare values between the control and uveitis groups over time. The mean preoperative flare values [0.44 ± 0.30, interquartile range (IQR): 0.33–0.55] was significantly increased in the uveitis group (uveitis: 9.1, IQR: 7.0–18.8) compared to that in the control group (control: 7.5, IQR: 6.2–9.8). At 1 and 3 months postoperatively, the mean flare values were significantly increased in the uveitis group (1 month: 21.3, IQR: 9.0–26.8; 3 months: 15.4, IQR: 9.1–34.1) compared to those in the control group (1 month: 9.6, IQR: 8.2–12.8; 3 months: 9.6, IQR: 7.6–11.9). The mean flare values at 3 months postoperatively were still higher than those at baseline in both groups. Laser flare values are shown in photon per millisecond (ph/ms). *P < 0.05; Mann–Whitney U-test.
![Figure 3 Comparison of aqueous flare values between the control and uveitis groups over time. The mean preoperative flare values [0.44 ± 0.30, interquartile range (IQR): 0.33–0.55] was significantly increased in the uveitis group (uveitis: 9.1, IQR: 7.0–18.8) compared to that in the control group (control: 7.5, IQR: 6.2–9.8). At 1 and 3 months postoperatively, the mean flare values were significantly increased in the uveitis group (1 month: 21.3, IQR: 9.0–26.8; 3 months: 15.4, IQR: 9.1–34.1) compared to those in the control group (1 month: 9.6, IQR: 8.2–12.8; 3 months: 9.6, IQR: 7.6–11.9). The mean flare values at 3 months postoperatively were still higher than those at baseline in both groups. Laser flare values are shown in photon per millisecond (ph/ms). *P < 0.05; Mann–Whitney U-test.](/cms/asset/19b90c6b-ea9b-44ba-9330-4a9a307a2488/doph_a_12177386_f0003_b.jpg)