Figures & data
Figure 1 The initial screen of wDDART.
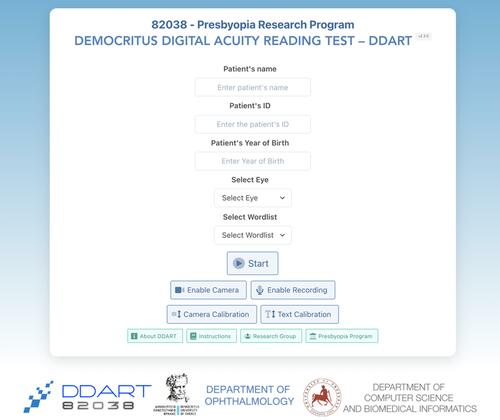
Figure 2 The control flow of the wDDART application (see the explanation of symbols used at the upper right corner of the figure).
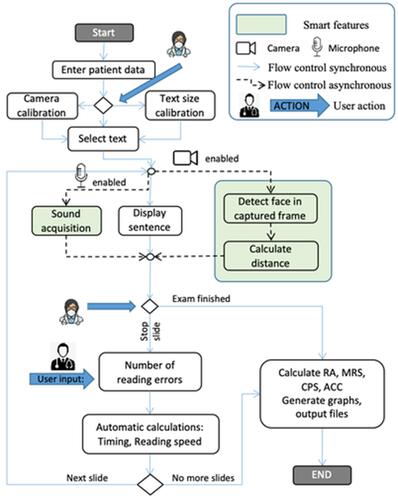
Figure 3 The text calibration screen.
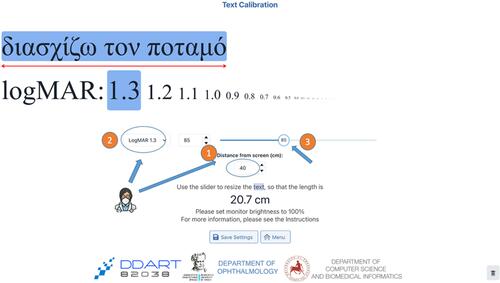
Figure 4 (A) The concept of face-camera distance calculation, (B) an exemplar screenshot of the camera calibration screen, with automatic face detection overlaid.
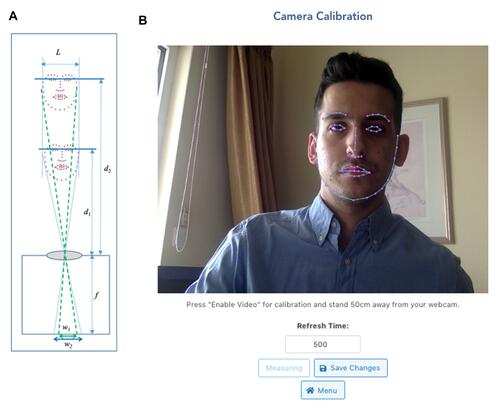
Figure 5 (A) Acquired sound x during patient read out of a random sentence. (B) The processed signal y (blue curve) and the signal values considered as non-reading (red color). The post-talk delay is graphically displayed.
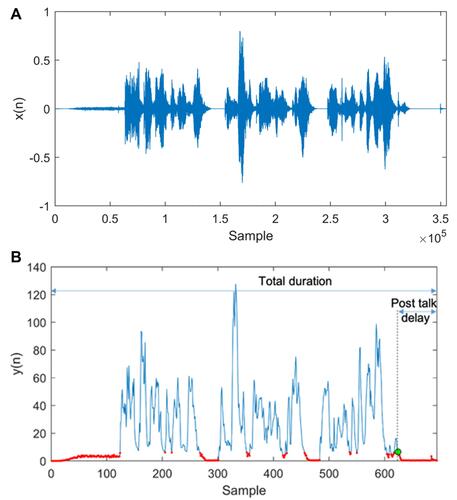
Figure 6 A typical example of wDDART’s output (html format).
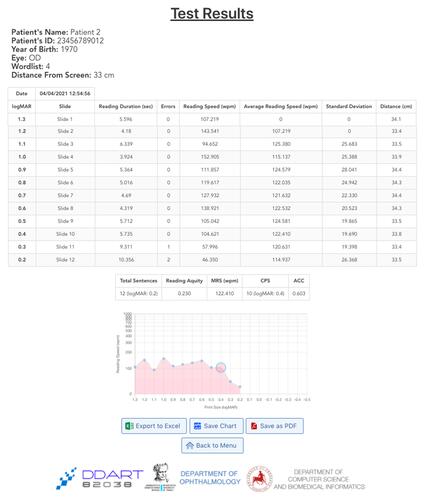
Figure 7 Typical examples of face detection at different distances (40, 70 and 100 cm), for two individuals with and without spectacles.
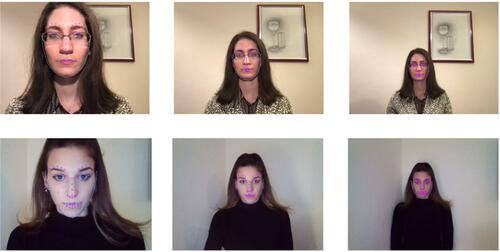
Table 1 Demographic Characteristics and Clinical Parameters
Table 2 Comparison of Calculated Reading Parameters Using DDART and wDDART
Figure 8 Comparison between wDDART and DDART for NVG and LVG using Bland–Altman plots: (A) RA, (B) MRS, (C) CPS, (D) ACC.
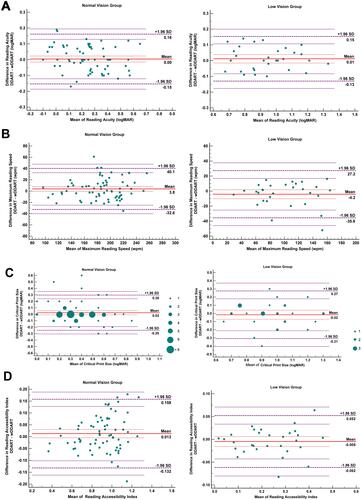
Table 3 ICCs (Two-Way Mixed Model with Measures of Absolute Agreement – Single Rating) and LoAs of Reading Parameters Between DDART and wDDART for the Different Study Groups
Table 4 wDDART Test–Retest ICCs (Two-Way Mixed Model with Measures of Absolute Agreement – Single Rating) and Repeatability LoAs of Reading Parameters for the Different Study Groups
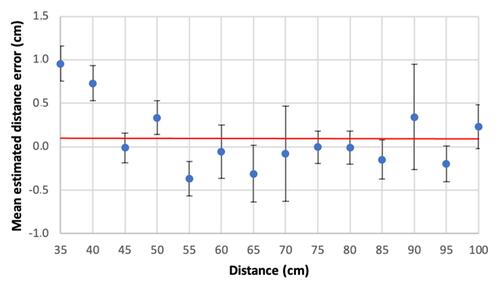
Figure 9 The average patient – camera distance estimation error, as a function of distance, with the 95% confidence intervals superimposed.