Figures & data
Table 1 Preoperative Demographic Characteristicsa of Subjects in the Low-DIOP, Mid-DIOP, and High-DIOP Strata
Table 2 Preoperative Demographic Characteristicsa of Subjects in the Low-Med, Mid-Med, and High-Med Strata
Figure 1 Proportion of Subjects with 24-Month Medication-Free Mean Diurnal Intraocular Pressure (DIOP) Reduction ≥20% from Baseline, Stratified By Baseline DIOP.
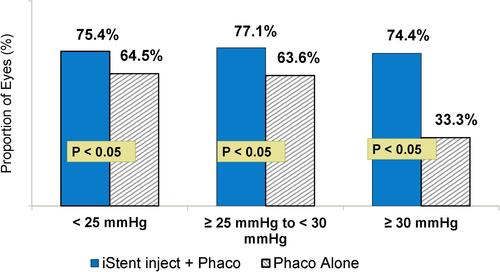
Figure 2 Average 24-Month Medication-Free Mean Diurnal Intraocular Pressure (DIOP) Change from Baseline, Stratified By Baseline DIOP.
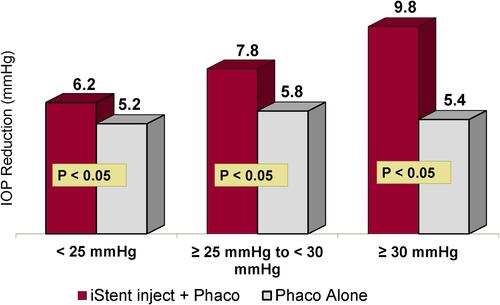
Figure 3 Proportion of Subjects with 24-Month Medication-Free Mean Diurnal Intraocular Pressure (DIOP) Reduction ≥20% from Baseline, Stratified By Number of Ocular Hypotensive Medications at Screening.
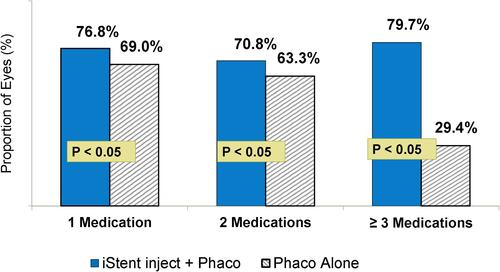
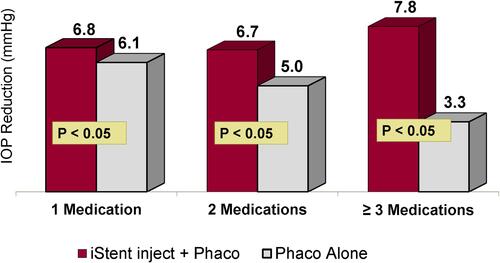
Figure 4 Average 24-Month Medication-Free Mean Diurnal Intraocular Pressure (DIOP) Change from Baseline, Stratified By Number of Ocular Hypotensive Medications at Screening.