Figures & data
Table 1 The Illustration of Prediction Error and Absolute Prediction Error for Each Formula
Table 2 Subgroup Analysis Showing the Absolute Prediction Error (APE) for Each Formula in Diopters (D) Among Patients Who Had in the Bag Implanted Intraocular Lens (IOL) versus Those with Sulcus Implanted IOL
Table 3 Correlation Between the Age, Axial Length (AL), Average Keratometric (K) Readings and the Absolute Prediction Error (APE) for the 4 Formulae
Table 4 Correlation Between the Age, Axial Length (AL), Average Keratometric (K) Readings and the Absolute Prediction Error (APE) for the 4 Formulae Among Patients Who Had in the Bag Implanted Intraocular Lens (IOL)
Table 5 Correlation Between the Age, Axial Length (AL), Average Keratometric (K) Readings and the Absolute Prediction Error (APE) for the 4 Formulae Among Patients Who Had Sulcus Implanted IOL
Figure 1 Comparison between the absolute prediction error (APE) of SRK II, Holladay I, Hoffer Q and SRK/T formulae.
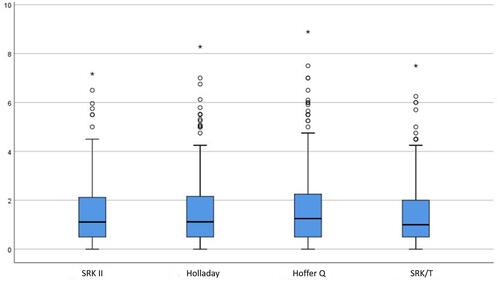
Figure 2 Comparison between the absolute prediction error (APE) of SRK II, Holladay I, Hoffer Q and SRK/T formulae in the subgroup of patients with mean preoperative keratometric (K) readings <46.5 diopter (D) and in those with mean preoperative K-reading ≥46.5 D.
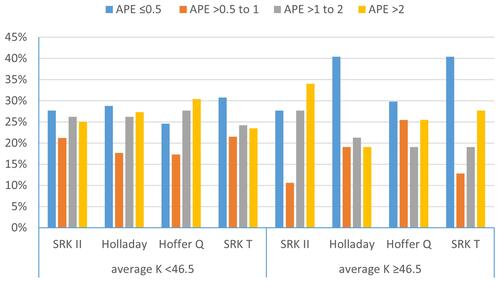
Figure 3 Comparison between the absolute prediction error (APE) of the SRK II, Holladay I, Hoffer Q and SRK/T formulae in different age groups.
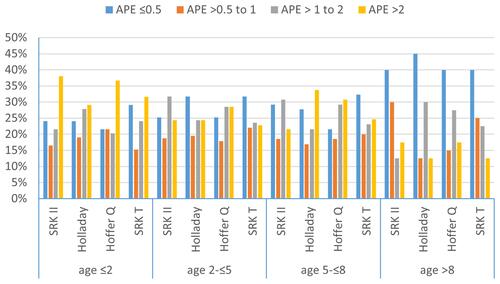
Figure 4 Analysis of the absolute prediction error (APE) of the SRK II, Holladay I, Hoffer Q and SRK/T formulae according to the preoperative axial length.
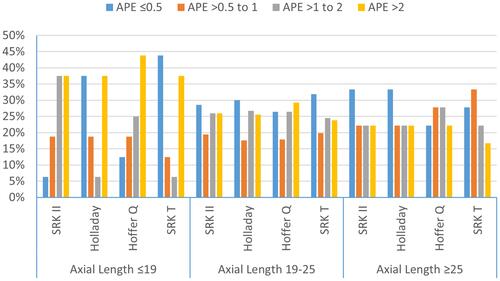
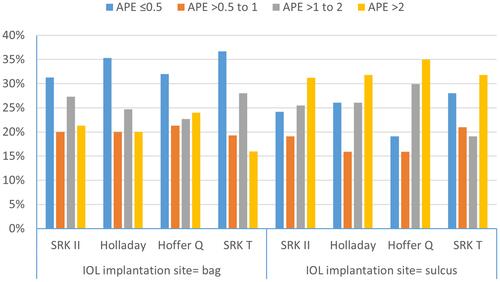
Figure 5 Analysis of the absolute prediction error (APE) of the SRK II, Holladay I, Hoffer Q and SRK/T formulae according to the site of intraocular lens implantation (IOL).