Figures & data
Table 1 Baseline Characteristics
Table 2 SS-OCT Optic Disc, RNFL and Macular Parameters Measurements in the Control Group
Table 3 SS-OCT Optic Disc, RNFL and Macular Parameters Measurements in the Surgical Group
Table 4 Correlation Between SS-OCT Parameters Change and IOP Change in the Surgical Group
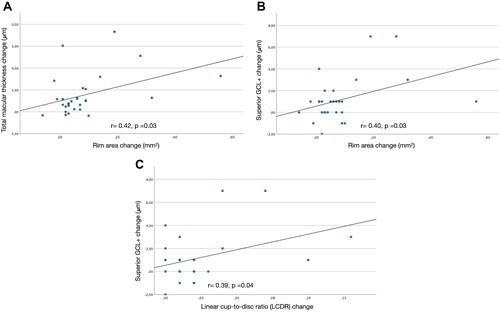
Figure 1 Scatter plots showing the relationship between topographic parameters improvement and macular parameters change. Rim area change demonstrated significant relationship with total macular thickness change (A) and superior GCL+ change (B). Linear cup-to-disc change demonstrated significant relationship with superior GCL+ change (C).