Figures & data
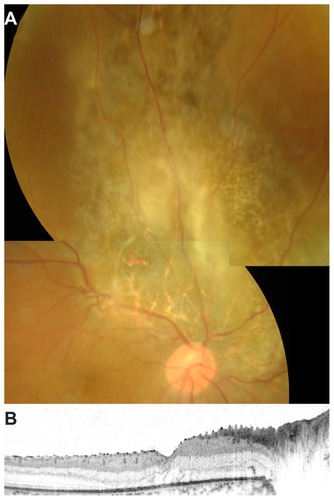
Figure 1 Color fundus photograph, fluorescein angiographic image, and spectral-domain optical coherence tomographic image at the initial visit for a 24-year-old man with aggressive retinal astrocytoma. The best-corrected visual acuity was 0.09. (A) Fundus photograph demonstrates an elevated lesion in the superior aspect of the optic disc accompanied with marked neovascular vessels located on the surface, retinal hemorrhage, and exudative change. Hard exudates are seen in the macula. (B) Late-phase fluorescein angiography reveals marked leakage from the neovascular vessels. (C) Horizontal optical coherence tomographic image through the fovea shows serous retinal detachment.
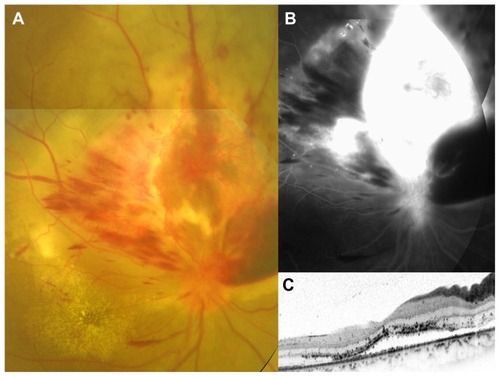
Figure 2 Color fundus photograph, fluorescein angiographic image, and spectral-domain optical coherence tomographic (OCT) images after six intravitreal injections of bevacizumab. The best-corrected visual acuity improved to 0.3. (A) Fundus photograph demonstrates marked regression of neovascular vessels, retinal hemorrhage, and exudative change. The direction of the OCT scan is indicated by a white arrow (C) or a black arrow (D). (B) Late-phase fluorescein angiography reveals decreased leakage from neovascular vessels. (C) Horizontal OCT image through the fovea shows disappearance of the serous retinal detachment. (D) Vertical OCT image through the elevated lesion shows a retinal tumor located on the retinal surface (black arrowhead) and epiretinal membrane (white arrowhead).
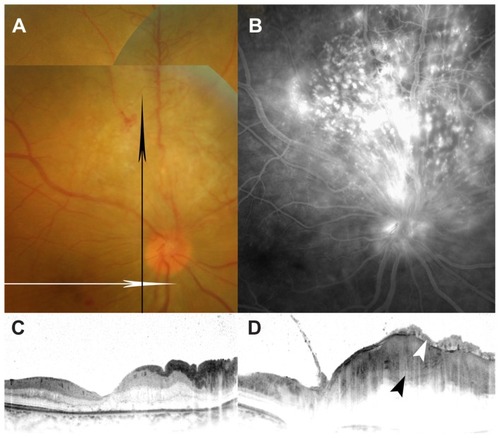
Figure 3 Histopathologic analysis of a biopsy sample of the retinal tumor which was obtained during pars plana vitrectomy.
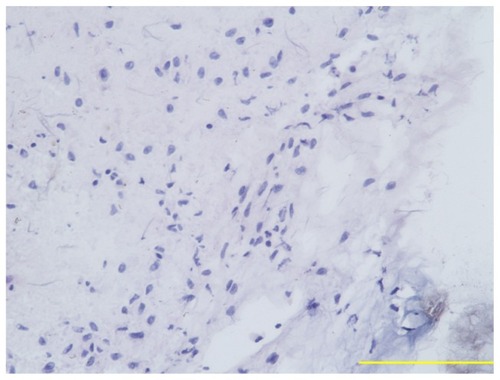
Figure 4 Immunoreactivity of biopsy sample of retinal tumor for vimentin (A), glial fibrillary acidic protein (B), neuron-specific enolase, (C), and vascular endothelial growth factor (D).
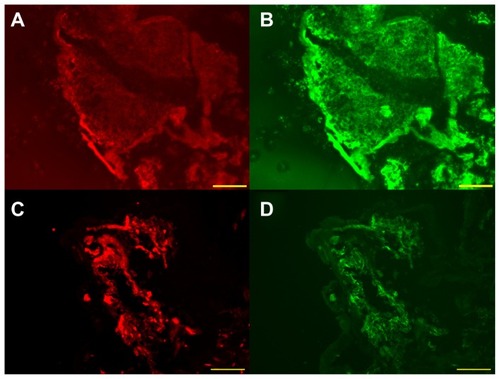
Figure 5 Immunoreactivity of surgically removed epiretinal membrane for vascular endothelial growth factor (A) and von Willebrand factor (B). (C) Nuclear staining of the same section. (D) Triple labeling.
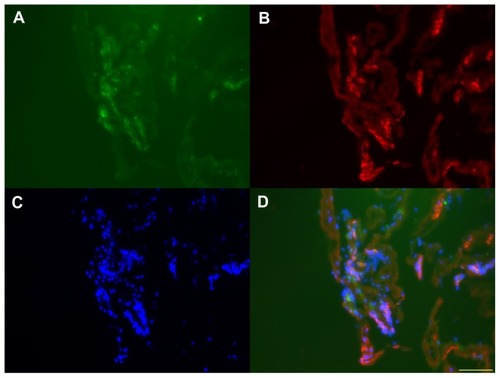
Table 1 Clinical and pathological findings
Figure 6 Color fundus photograph and spectral-domain optical coherence tomographic image after pars plana vitrectomy. The best-corrected visual acuity was 0.2. (A) Fundus photograph demonstrates retinal photocoagulation scars corresponding to retinal astrocytoma. Small residual retinal astrocytoma is seen in the center of the photocoagulation scars. (B) Horizontal optical coherence tomographic image through the fovea shows no serous retinal detachment.