Figures & data
Table 1 Preoperative Patient Demographics and Ocular Characteristics
Figure 1 Representative swept-source OCT of normal foveas. (A–C) Representative IOLMaster 700 SS-OCT of three different non-pathological foveas, with inner retinal (IR) layers, outer retina (OR) layers, Bruch’s Membrane (BM), retinal pigment epithelium (RPE), photoreceptor layer (PR), and choroid (CH) layer denoted.
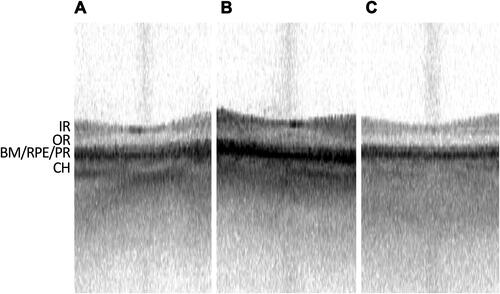
Table 2 Analysis of Efficacy of SS-OCT and SD-OCT in Detecting Macular Pathology and Most Common Macular Pathologies Identified
Figure 2 Epiretinal membrane appearance on swept-source OCT and spectral-domain OCT. (A–C, left) IOLMaster 700 SS-OCT scans of three different eyes with epiretinal membranes, demonstrating foveal thickening and intraretinal cystic spaces (arrowheads). (A–C, right) Corresponding Spectralis SD-OCT scans of epiretinal membranes (arrows) for comparison.
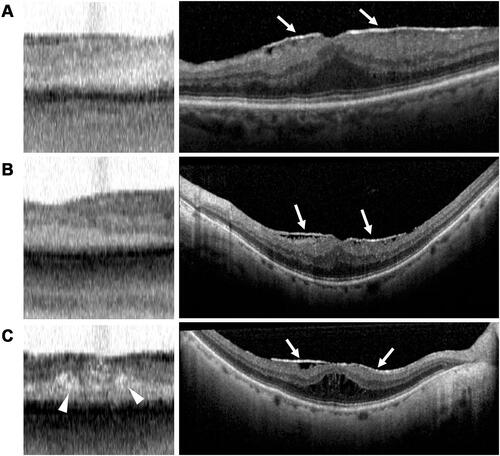
Figure 3 Macular edema appearance on swept-source OCT and spectral-domain OCT. (A and B, left) IOLMaster 700 SS-OCT scans of two different eyes with macular edema, demonstrating retinal thickening with intraretinal (black arrowheads) and subretinal fluid (black arrow). (A and B, right) Corresponding Spectralis SD-OCT scans of macular edema with intraretinal (white arrowheads) and subretinal (white arrow) fluid.
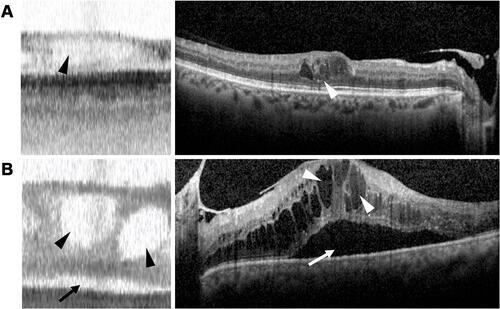
Figure 4 Drusen appearance on swept-source and spectral-domain OCT. (A–C, left) IOLMaster 700 SS-OCT scans of three different eyes with macular drusen (arrowheads) and retinal pigment epithelium (RPE) layer deformation (arrows). (A–C, right) Corresponding Spectralis SD-OCT scans of drusen (arrowheads) with RPE deformation (arrows).
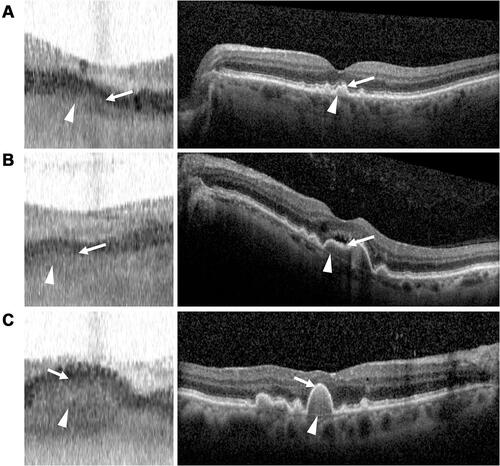
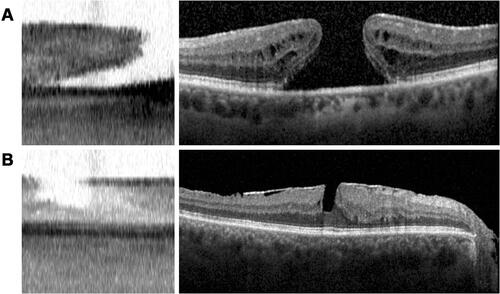
Figure 5 Macular hole appearance on swept-source and spectral-domain OCT. (A and B, left) IOLMaster 700 SS-OCT scans of two different eyes with macular holes. (A and B, right) Corresponding Spectralis SD-OCT scans of macular holes.