Figures & data
Table 1 Summary Statistics of Keratometry and Refractive Results Obtained at Post-Operative Follow-Up Visits (95% Confidence of Interval)
Figure 1 Kmax value (in diopters) taken from Pentacam readings at the pre- as well as 1-month, 3-months, 6, and 12-months post-operative visits. Error bars represent 95% confidence intervals.
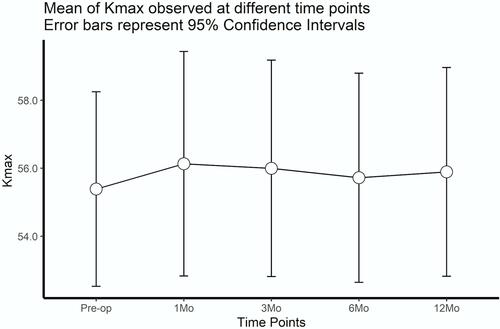
Figure 2 Mean change in Kmax in dioptres at each post-operative visit compared to baseline.
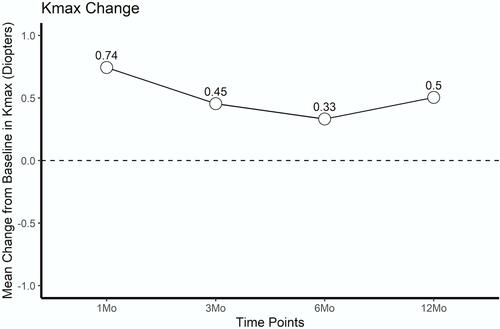
Figure 3 Kmax distribution change in dioptres, from baseline to 12 months.
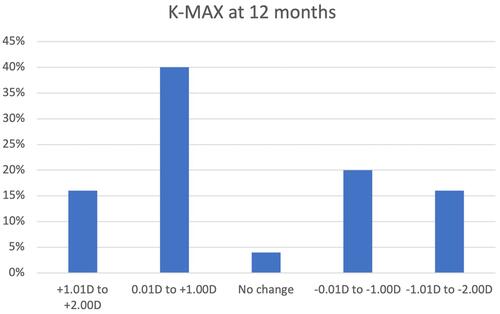
Table 2 Summary Statistics of UCVA and BCVA Data Obtained at Post-Operative Follow-Up Visits (95% Confidence of Interval)
Figure 4 Mean Uncorrected Distance Visual Acuity (UCVA) in LogMAR at baseline as well as 1-month, 3-months, 6, and 12-months post-operative visits. Error bars represent 95% confidence intervals.
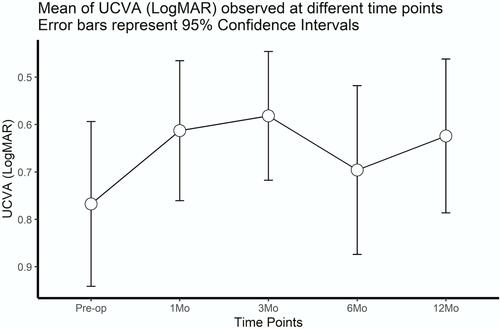
Figure 5 Mean Best-Corrected Distance Visual Acuity (BCVA) measured at baseline as well as 1-month, 3-month, 6, and 12-months post-operative visits. Error bars represent 95% confidence intervals.
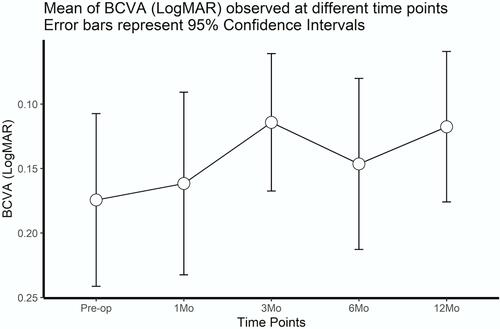
Figure 6 Mean change in BCVA and UCVA at post-operative visits.
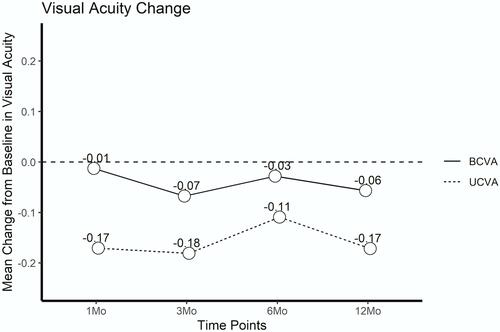
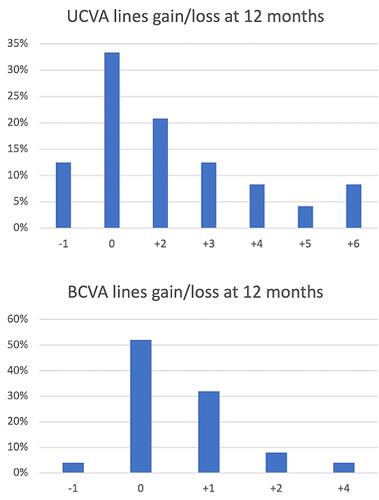
Figure 7 Visual acuity distribution gain or loss of lines, from baseline to 12 months.