
Figures & data
Figure 1 Distribution of IOP change after 12 weeks from baseline. The distributions of IOP changes with each eye drop added to PGA monotherapy after administration for 12 weeks were investigated and analyzed using the two-sided F-test.
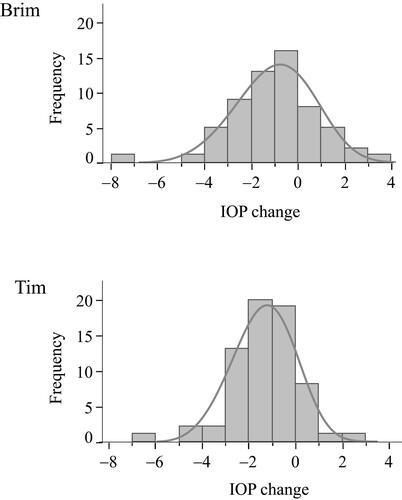
Table 1 Effects of Patient Background Factors on IOP Decrease
Figure 2 IOP-lowering effects of Brim and Tim stratified by baseline IOP on PGA. For IOP < 12 mmHg, n = 9 for Brim and 6 for Tim; for IOP ≤ 12 and <14 mmHg, n = 28 for Brim and 26 for Tim; and for IOP ≤14 and ≤ 16 mmHg, n = 24 for Brim and 35 for Tim. *P < 0.05, **P < 0.01, vs baseline IOP. Error bars represent standard deviation.
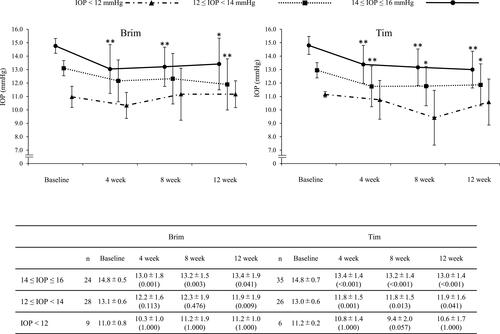
Figure 3 Pulse rates stratified by age. **P < 0.001. The values inside the bars and the values in the parentheses indicate the mean value and the number of cases, respectively. Error bars represent standard error.
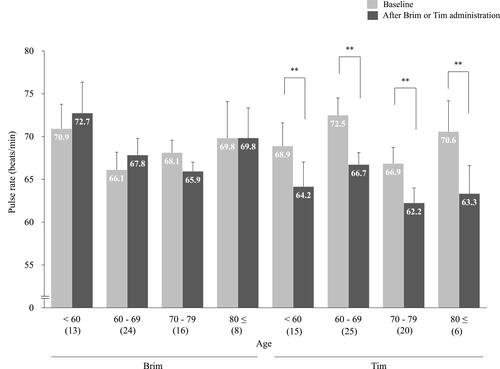
Figure 4 Blood pressures stratified by age. *P < 0.05, **P < 0.01. The values inside the bars indicate the mean value. Error bars represent standard error.
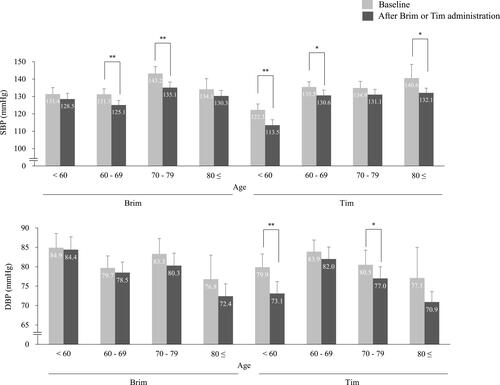
Table 2 Effects of Patient Background Factors on PR
Table 3 Effects of Patient Background Factors on BP (A and B)
Table 4 Non-Inferiority Analysis of Brim to Tim After Stratification by Baseline IOP on PGA Monotherapy