Figures & data
Table 1 Technical Specifications of the IPL and LLL Treatment
Table 2 Demographic Data (n=62 Eyes/31 Patients)
Table 3 Outcomes Before and After IPL+LLL Treatment (n=62)
Figure 1 (A) Mean OSDI at 2–3 weeks after IPL and LLL treatment according to presence of gender (p=0.004), previous ocular surgery (p=0.002), lowering ocular hypertension drops (p=0.028) and corneal fluorescein staining (CFS) after treatment (p<0.001). (B) Mean OSDI at 6 months after IPL and LLP treatment according to presence of previous ocular surgery (p=0.021). Gender, lowering ocular hypertension drops and CFS only correlate with OSDI at 2–3 weeks after IPL and LLL treatment.
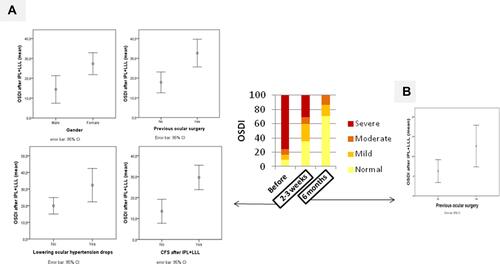
Table 4 Correlations with OSDI in Different Times
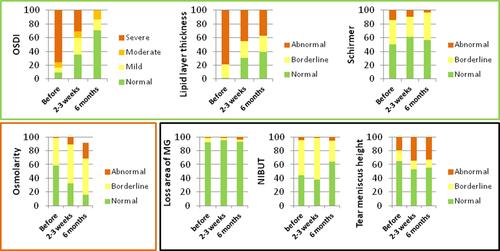
Figure 2 OSDI, lipid layer thickness, Schirmer, osmolarity, loss area of MG, NIBUT and tear meniscus height grade frequencies at before, 2–3 weeks and 6 months after IPL and LLL treatment. OSDI grade: normal (0–12), mild (13–22), moderate (23–32) and severe (33–100). Lipid grade: abnormal (<60), borderline (60–80) and normal (>80). Schirmer grade: abnormal (<5), borderline (5–10) and normal (>10). Loss area of MG grade: abnormal (>60), borderline (40–60) and normal (<40). Osmolarity grade: abnormal (>320), borderline (300–320) and normal (<300). NIBUT grade: abnormal (<5), borderline (5–10) and normal (>10). Tear meniscus height grade: abnormal (<0.22), borderline (>0.44) and normal (0.22–0.44). Green square include variables that improved grade’s frequency: OSDI (p<0.001), lipid layer thickness (p<0.001) and Schirmer (p=0.023). Black square include variables that didn´t change grade’s frequency: loss area of MG (p=0.773), NIBUT (p=0.076) and tear meniscus height (p=0.153). Red square included variables that worsened grade’s frequency: osmolarity (p<0.001).