Figures & data

Table 1 Patient Characteristics and Procedures Performed
Figure 1 The mean surgical planning time was significantly reduced for post refractive (P < 0.00001), non post-refractive (P < 0.00001), and combined patients (P < 0.00001).
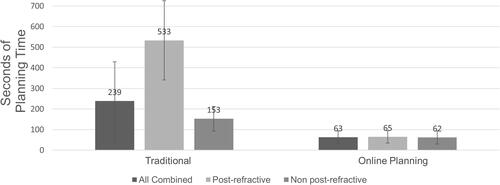
Figure 2 The mean manual transcription of data points was significantly reduced for post refractive (P < 0.00004), non post-refractive (P < 0.0000001), and combined patients (P < 0.0000001).
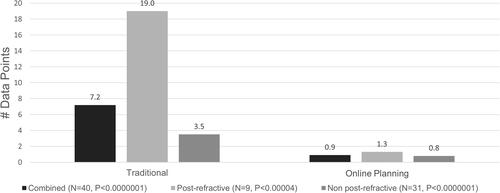
Table 2 Implications for Preventing Errors
Figure 3 Per eye estimated likelihood of error in post-refractive patients using traditional methods was 2 in 3 eyes vs 1 in 22 eyes for the online software. Likelihood of error for non-post refractive patients using traditional methods was 1 in 8 eyes vs 1 in 36 eyes for the online software.
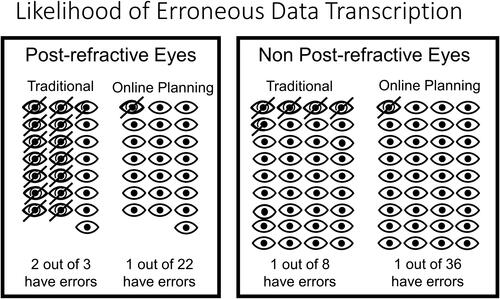
Figure 4 Refractive accuracy was roughly equivalent in both study arms, thus no significant differences were noted in mean absolute prediction error for traditional methods and online software.
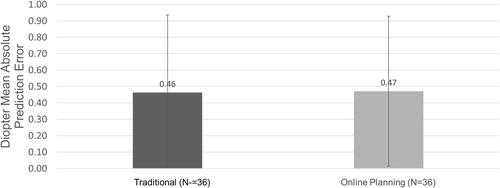
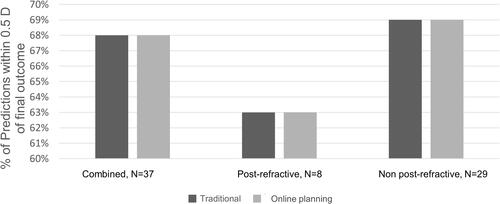
Figure 5 Intended postoperative manifest spherical equivalent refraction was found within 0.5D predicted value for all enrolled patients, thus no significant differences were noted between traditional methods and online software.