
Figures & data
Table 1 Frequency and Rates of Eye Injuries in Professional Mixed Martial Arts Competition in Nevada from September 2001 to March 2020
Figure 1 Relationship between year of competition and rate of eye injuries sustained per 100 fighters involved from September 2001 to March 2020, with corresponding p-value for Mann–Kendall testing in the upper right-hand corner.
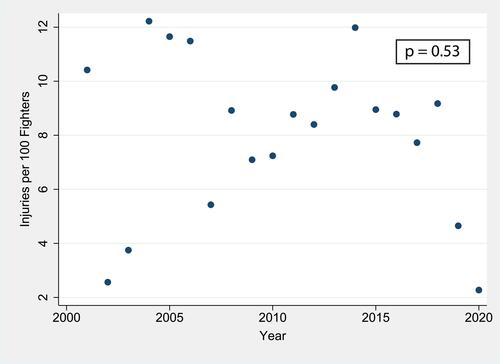
Table 2 Decisions Rendered for Fighters Who Sustained an Ophthalmic Injury During Professional Mixed Martial Arts Competition from September 2001 to March 2020
Figure 2 Type of eye injuries sustained by fighters in professional mixed martial arts competitions from September 2001 to March 2020.
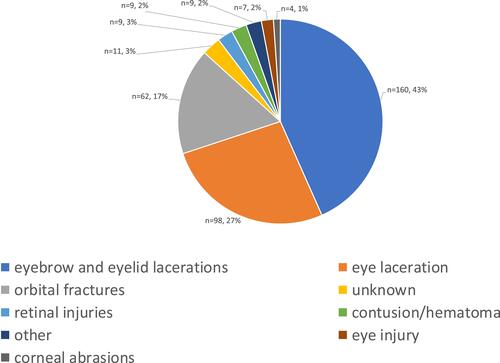
Table 3 Mean No-Contact Time Recommended by Ringside Physicians for Mixed Martial Arts Fighters Sustaining Various Ophthalmic Injuries, September 2001 to March 2020