
Figures & data
Figure 1 (A) Demonstrates automated segmentation showing two types of the cyst (inner nuclear layer [INL] and outer plexiform layer [OPL] in the en face optical coherence imaging (OCT) scan). (B) Shows manual segmentation with an en face scan of the INL, small multiple circular cysts occupying a larger area on the en face. (C) shows manual segmentation with an en face scan of the OPL, note larger, radially oriented cyst occupying a smaller area around the macular hole in comparison to the INL.
![Figure 1 (A) Demonstrates automated segmentation showing two types of the cyst (inner nuclear layer [INL] and outer plexiform layer [OPL] in the en face optical coherence imaging (OCT) scan). (B) Shows manual segmentation with an en face scan of the INL, small multiple circular cysts occupying a larger area on the en face. (C) shows manual segmentation with an en face scan of the OPL, note larger, radially oriented cyst occupying a smaller area around the macular hole in comparison to the INL.](/cms/asset/96a22aa9-b0d5-46b9-8ef1-403b182b409f/doph_a_12177444_f0001_c.jpg)
Figure 2 (A) Cross-sectional spectral-domain optical coherence imaging (SD-OCT) image showing preoperative ellipsoid zone (EZ; yellow line) and external limiting membrane (ELM; green line) defect measurements. (B) Cross-sectional SD-OCT image showing postoperative EZ and ELM defect measurements. (C) Preoperative en face OCT scan showing measurement of minimum inlet diameter of macular hole (yellow). (D) Preoperative en face OCT scan showing measurement of the base diameter of macular hole (yellow).
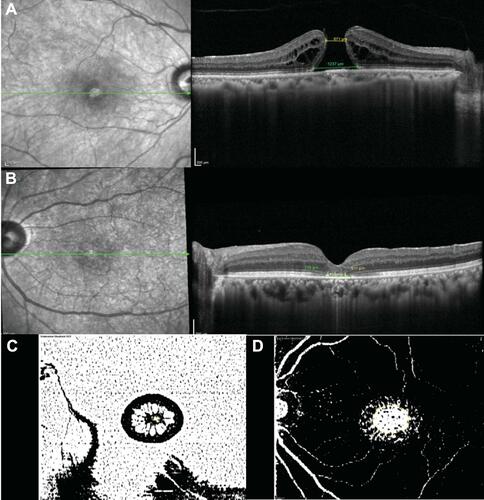
Table 1 Difference Between the Preoperative Variables in the Two Groups
Table 2 Difference Between the Postoperative Variables in the Two Groups
Table 3 Difference Between the Area of Cyst Involvement Within the Retinal Layers in the Study Eyes
Table 4 Difference Between the Percentage of Cysts Involvement Within the Retinal Layers in the Study Eyes
Figure 3 Group 1; (A) Binarized en face scan of the outer plexiform layer (OPL), with an outer yellow outline of the area of the cyst and inner yellow outline of the area of macular hole. The area between the two yellow outlines denotes the area of OPL cysts (B) Binarized en face scan of the inner nuclear layer (INL), with an outer yellow outline of the area of the cyst and inner yellow outline of the area of macular hole. The area between the two yellow outlines denotes the area of the OPL cyst. (C) Binarized en face scan of the base diameter, with the area marked in yellow. Note the positive correlation in the INL and OPL area and between the basal diameter and OPL/INL cyst area. ( and 3) (D) Binarized en face scan of the minimum inlet diameter of the hole, with the area marked in yellow. (E) Cross-sectional spectral-domain optical coherence imaging (SD-OCT) showing preoperative ellipsoid zone (EZ) and external limiting membrane (ELM) loss. (F) Cross-sectional SD-OCT image showing the postoperative ELM and EZ loss.
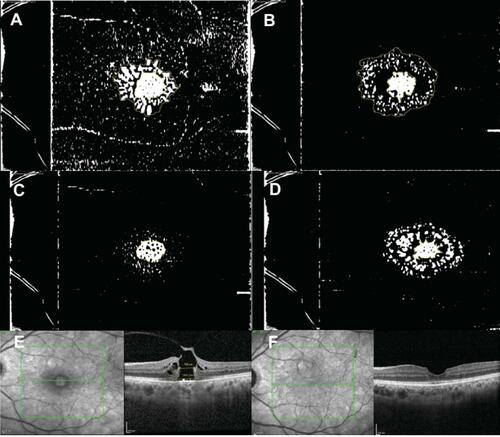
Figure 4 Group 2; (A) Binarized en face scan of the outer plexiform layer (OPL), with an outer yellow outline of the area of the cyst and inner yellow outline of the area of macular hole. The area between the two yellow outlines denotes the area of OPL cysts (B) Binarized en face scan of the inner nuclear layer (INL), with an outer yellow outline of the area of the cyst and inner yellow outline of the area of macular hole. The area between the two yellow outlines denotes the area of the OPL cyst. (C) Binarized en face scan of the base diameter, with the area marked in yellow. (D) Binarized en face scan of the minimum inlet diameter of the hole, with the area marked in yellow. (E) Cross-sectional spectral-domain optical coherence imaging (SD-OCT) showing preoperative ellipsoid zone (EZ) and external limiting membrane (ELM) loss. (F) Cross-sectional SD-OCT image showing the postoperative ELM and EZ loss.
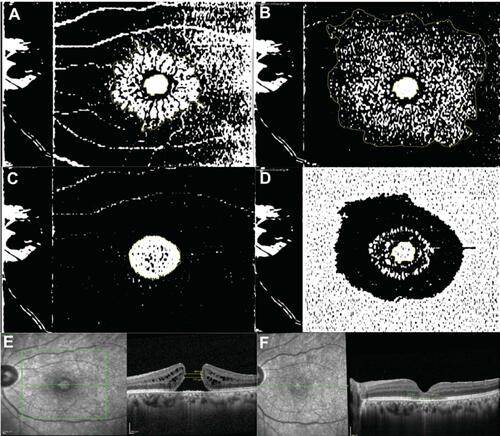
Table 5 Correlation of Intraretinal Cysts with Other Parameters in the Study Eyes