
Figures & data
Figure 1 Anterior segment optical coherence tomography of a healthy cornea using an HD-OCT (Envisu R2210, Bioptigen, Leica, Buffalo Grove, IL, USA) collected at the Bascom Palmer Eye Institute.
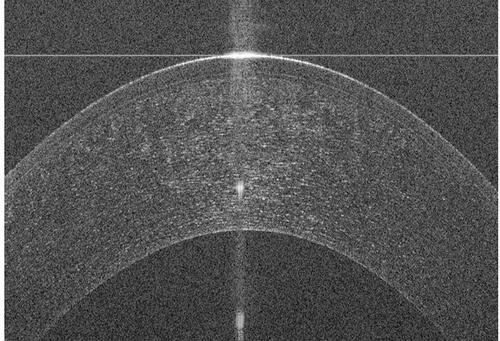
Figure 2 Flowchart of the distribution of images throughout the training and testing of the deep learning model, including the quality control phase and grouping of images within the healthy and dry eye disease groups.
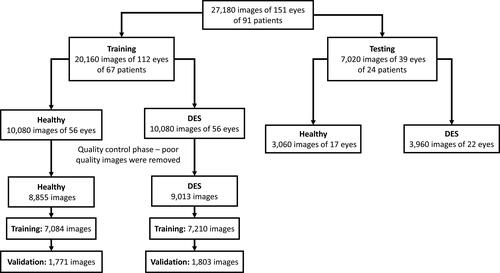
Table 1 Demographics
Figure 3 Training accuracy, validation accuracy, and cross entropy loss function plots during training phase of deep learning model. Training accuracy (performance in percentage) to correctly identify a trained image, validation accuracy (performance in percentage) to correctly identify a nontrained image (A) and cross entropy loss function (B) over 5710 iterations or training steps.
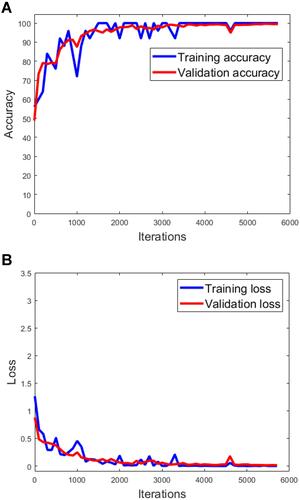
Figure 4 Results of the occlusion testing showing features of the OCT image recognized by the deep learning model. (A) AS-OCT images of a cornea with dry eye disease on the left and a healthy cornea on the right with (B) visualization of the learned features of the deep learning neural network.
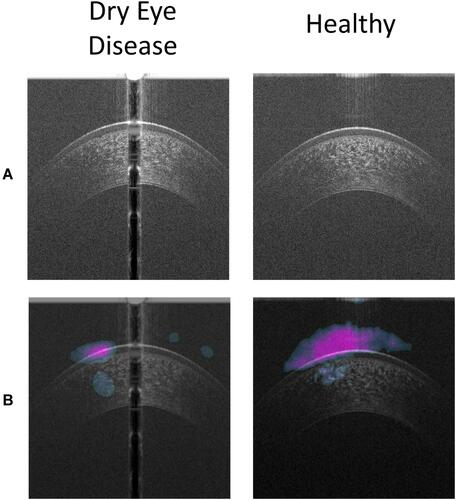
Table 2 Results from the Testing Phase