Figures & data
Table 1 Patient Demographics
Figure 1 Distribution of uncorrected near visual acuity at postoperative day one (A), one-month (B), and three-months (C) in the AcrySof IQ PanOptix and TECNIS Symfony groups.
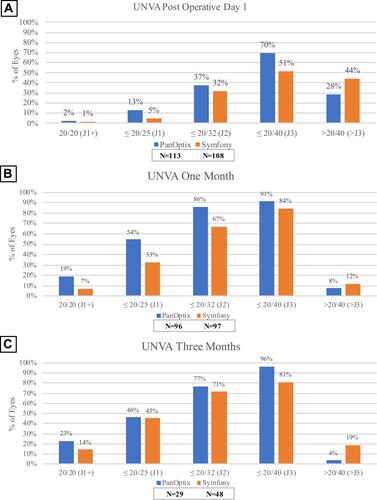
Figure 2 Distribution of uncorrected distal visual acuity at postoperative day one (A), one-month (B), and three-months (C) in the AcrySof IQ PanOptix and TECNIS Symfony groups.
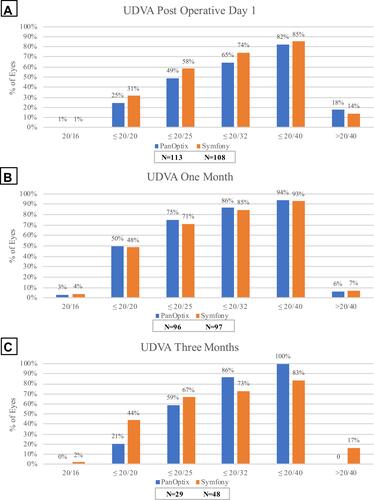
Figure 3 Distribution of corrected distal visual acuity at one-month (A) and three-months (B) in the AcrySof IQ PanOptix and TECNIS Symfony groups.
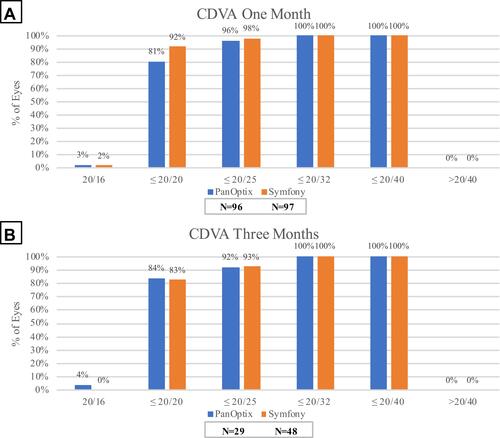
Figure 4 Distribution of secondary visual symptoms in the AcrySof IQ PanOptix and TECNIS Symfony groups at one-month (A) and three-months (B).
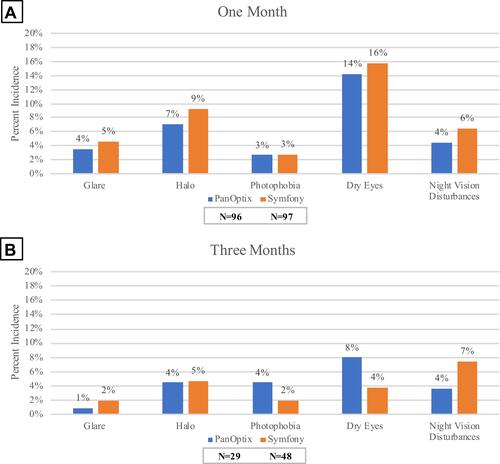
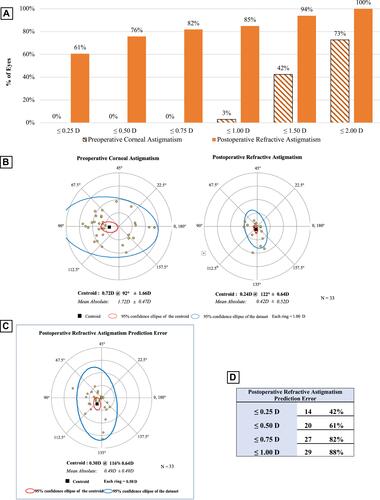
Figure 5 Vector analysis for the AcrySof IQ PanOptix group. (A) Cumulative histogram of the magnitude of the preoperative corneal astigmatism and postoperative refractive astigmatism. (B) Double-angle plots of the preoperative corneal astigmatism and postoperative refractive astigmatism. The centroid and standard deviation are shown. (C) Double-angle plot of postoperative refractive astigmatism prediction error. (D) Postoperative refractive astigmatism prediction error values.
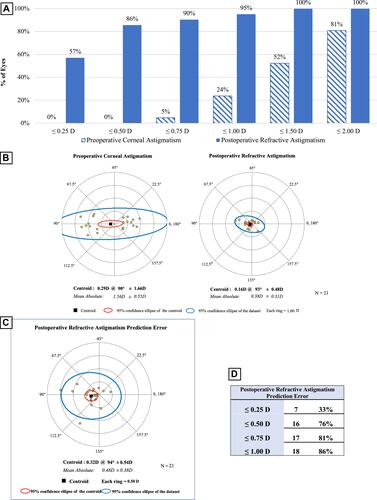
Figure 6 Vector analysis for the TECNIS Symfony group. (A) Cumulative histogram of the magnitude of the preoperative corneal astigmatism and postoperative refractive astigmatism. (B) Double-angle plots of the preoperative corneal astigmatism and postoperative refractive astigmatism. The centroid and standard deviation are shown. (C) Double-angle plot of postoperative refractive astigmatism prediction error. (D) Postoperative refractive astigmatism prediction error values.