
Figures & data
Table 1 Corneal Epithelial Stem Cell-Derived Supernatant for Dry Eye Disease. Baseline Demographics and Characteristics of the Study Population
Figure 1 Corneal epithelial stem cell-derived therapy for dry eye disease. Flow chart for enrollment into the clinical trial.
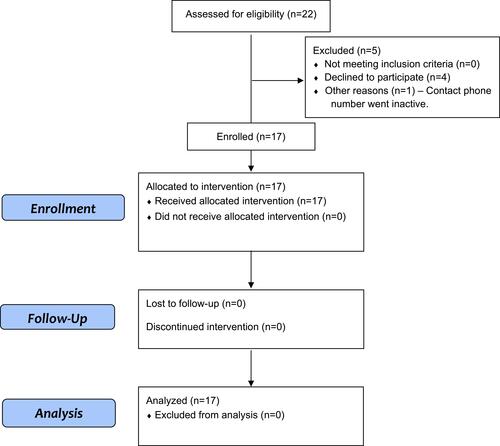
Table 2 Corneal Epithelial Stem Cell-Derived Supernatant for Dry Eye Disease. Average Baseline versus Twelve Week Post-Treatment Outcome Comparisons
Figure 2 Corneal epithelial stem cell-derived supernatant for dry eye disease. Mean patient reported outcome measurements of over various time intervals during the 12 week treatment period for (A) Standardized Patient Evaluation of Eye Dryness (SPEEDTM) Questionnaire, (B) Ocular Surface Disease Index (OSDI©) Score and (C) Visual Analog Scale (VAS).
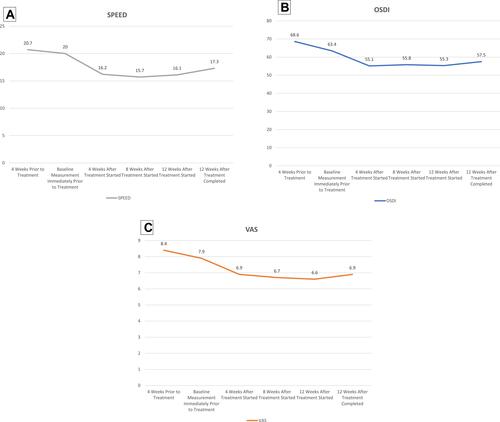
Table 3 Corneal Epithelial Stem Cell-Derived Supernatant for Dry Eye Disease. Patient Reported Outcome Measurement Comparisons for Change in Four Week Pre-Treatment Baseline from Immediate Pre-Treatment Baseline versus Change in Immediate Baseline from Average Post-Treatment Values