Figures & data
Table 1 Patient Demographic Data
Table 2 Postoperative Outcomes and Adverse Effects
Figure 1 Scattergram of preoperative and postoperative intraocular pressure (IOP) at the final visit in all eyes. Each point represents one eye with the preoperative IOP as the abscissa and the postoperative IOP as the ordinate. The horizontal red line indicates 18 mmHg, and the oblique red line indicates a 20% reduction from the preoperative IOP.
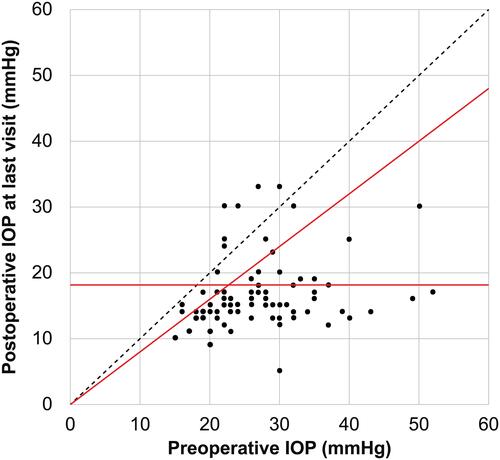
Figure 2 Box plot of the intraocular pressure (IOP) and observation time in all eyes. The box plots show the median, and 25th and 75th percentiles of the data. Asterisks and circles denote outliers. The graph shows a significant reduction in IOP after trabeculotomy (TLO). Number of eyes were as follows: PREOPE (n=81), POD1 (n=81), POD7 (n=81), POD1M (n=81), POD2M (n=76), POD3M (n=77), POD6M (n=79), POD9M (n=79), POD12M (n=79), and LASTVISIT (n=81).
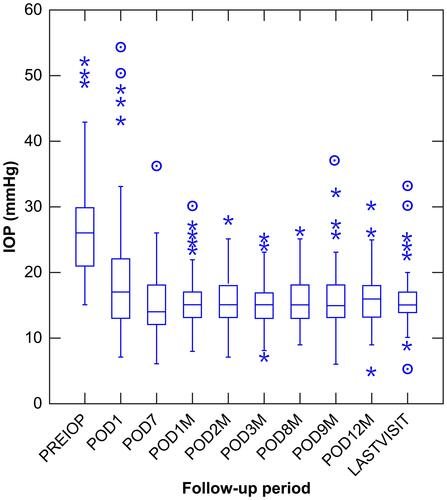
Figure 3 Results of Kaplan-Meier survival curve analysis in all eyes. The definition of surgical success was a postoperative intraocular pressure (IOP) of ≤18 mmHg and ≥20% reduction in from the preoperative IOP, without additional glaucoma surgery.
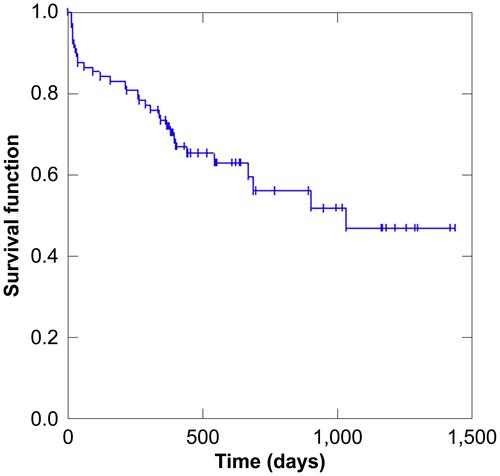
Figure 4 Results of Kaplan-Meier survival curve analysis for both procedures. There were no significant differences in success rates between ab interno trabeculotomy (AbI-TLO, red line) and ab externo trabeculotomy (AbE-TLO, blue line, Log-rank test; p=0.875).
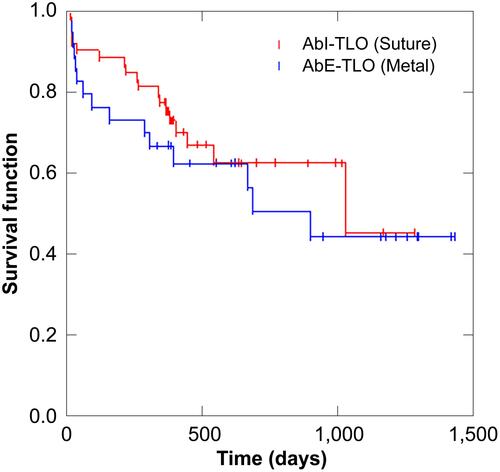
Table 3 Results of Univariate and Multivariate Analyses
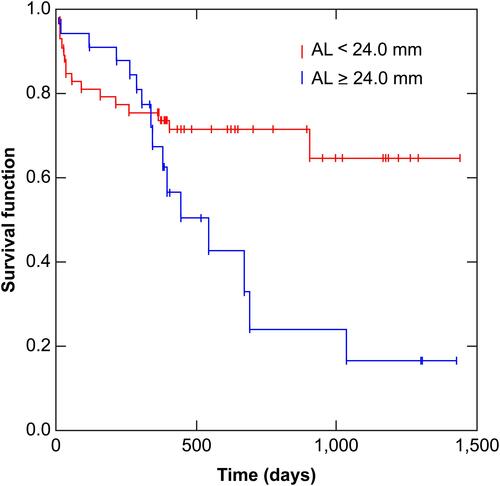
Figure 5 Results of Kaplan-Meier survival curve analysis stratified according to the axial length of 24.0 mm. The axial length was <24.0 mm (red line) or ≥24.0 mm (blue line). Eyes with an axial length <24.0 mm had significantly better outcomes than eyes with an axial length ≥24.0 mm (Log-rank test; p=0.031).