Figures & data
Figure 1 The proportion of patients with MGD was unaffected by triglyceride levels, cholesterol/HDL ratio, and non-HDL cholesterol. (A) Triglyceride levels were separated into three categories: Normal (<150 mg/dL), borderline high (150–199 mg/dL), and high to very high (200 mg/dL and higher). There was a trend, although not significant, towards an increase in MGD in the borderline high and high categories (P = 0.411, chi-square test). (B) The cholesterol/HDL ratio was subdivided into normal (< 5.0) and high (>/= 5.0). There were no differences in the proportion of MGD to non-MGD dry eye patients with normal or high ratios (P=0.649, chi-square test). (C) Non-HDL cholesterol was subdivided into normal (95–160 mg/dL), high (161 mg/dL and higher), and low (< 95 mg/dL). There were no differences between groups (P = 0.680, chi-square test).
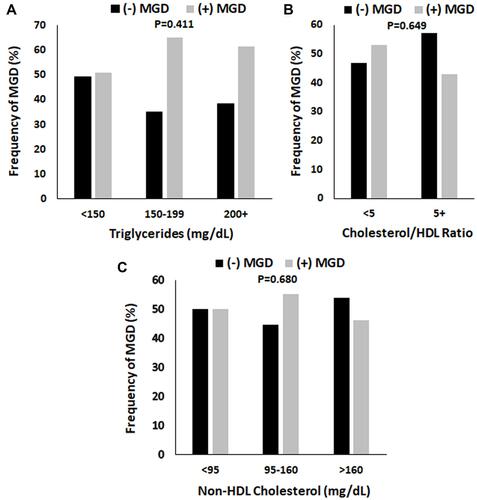
Table 1 Patient Demographics and Pertinent Ocular/Medical History
Table 2 Serological Measures
Table 3 Patient Factors Associated with MGD
Table 4 Serology Measures Associated with MGD
Figure 2 The proportion of patients with MGD in both the female and male groups were unaltered by fasting blood glucose levels. Fasting blood glucose levels were separated into three groups: Normal (< 100 mg/dL), pre-diabetes (100–125 mg/dL), and diabetes (126 mg/dL and higher). (A) In females, there were no differences in the proportion of patients with MGD regardless of the fasting blood glucose level (P = 0.611, chi-square). (B) Similarly, in males, there were no differences in the proportion of patients with MGD across fasting blood glucose levels (P = 0.927, chi-square). However, the frequency of MGD was increased two-fold compared to non-MGD patients, regardless of fasting blood sugar.
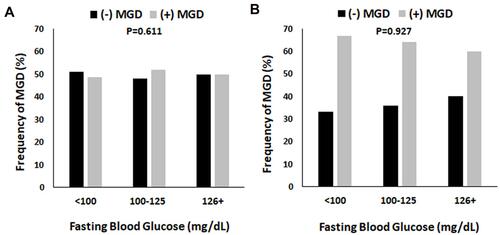
Figure 3 The proportion of patients with MGD in both the female and male groups were unaltered by serum cholesterol levels. (A and B) Total cholesterol levels were defined as normal (< 200 mg/dL) or high (200 mg/dL and above). There were no differences in the proportion of MGD in females (P = 0.826, chi-square test, panel (A) or males (P = 1.000, chi-square test, panel (B). (C and D) HDL cholesterol was defined as low (< 39 mg/dL) or good (40 mg/dL and above). While there were fewer females with MGD in the normal group compared to non-MGD, this was not significant (P = 0.783, chi-square test, panel (C). No differences were seen in the high group. In contrast to this, there were no differences in the proportion of males with MGD compared to non-MGD in either the normal or high group (P = 1.000, chi-square test, panel (D). (E and F) LDL cholesterol was defined as normal (< 100 mg/dL) or high (100 mg/dL and above). There were no differences in the frequency of female patients with MGD in either the normal or high categories (P = 0.365, chi-square test, panel (E). Likewise, no differences were noted for males (P = 0.668, chi-square test, panel (F).
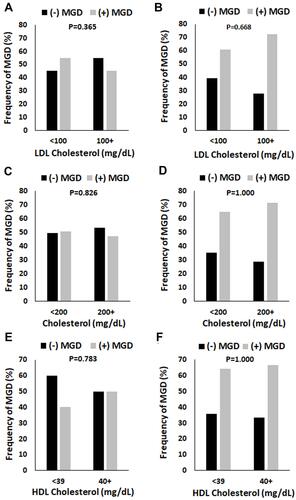
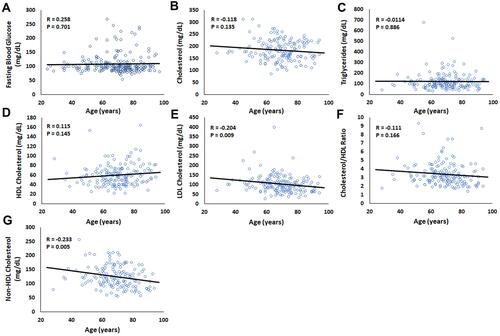
Figure 4 Older age was weakly associated with lower levels of LDL cholesterol (mg/dL) and non-HDL cholesterol (mg/dL). A Pearson product moment correlation was calculated to determine the relationship between each serological measure and patient age. (A) Fasting blood glucose, R = 0.258, P = 0.701. (B) Cholesterol, R = −0.118, P = 0.135. (C) Triglycerides, R =−0.0114, P = 0.886. (D) HDL cholesterol, R = 0.115, P = 0.145. (E) LDL cholesterol, R = −0.204, P = 0.009. (F) Cholesterol/HDL ratio, R = −0.111, P = 0.166. (G) Non-HDL cholesterol, R = −0.233, P = 0.005.