
Figures & data
Table 1 Preoperative Patient Demographics
Figure 1 Postoperative residual astigmatism in eyes using intraoperative aberrometry (PRA) and preoperative planned power (BRA).
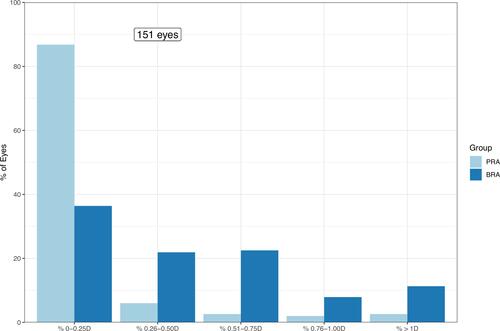
Figure 2 Double-angle vector plots of astigmatism vectors for (A) preoperative, (B) intraoperative aberrometry, and (C) preoperative planned power. Each ring represents 1 D. The diamond represents the centroid. N=151 eyes.
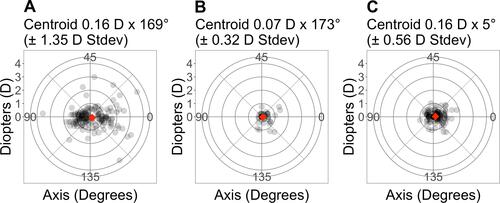
Figure 3 Postoperative refractive prediction errors in eyes using intraoperative aberrometry (IA) and preoperative planned power (PC).
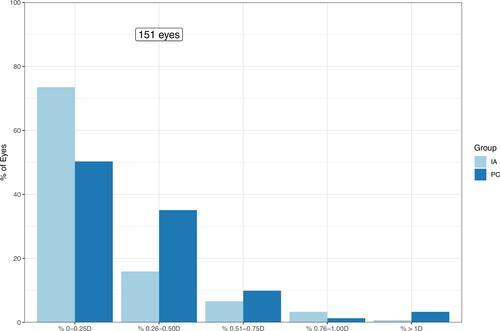
Figure 4 Standard graphs for reporting refractive outcomes: (A) uncorrected distance visual acuity (UDVA); (B) UDVA vs corrected distance visual acuity (CDVA); (C) spherical equivalent refraction accuracy; and (D) postoperative refractive cylinder. D = diopters.
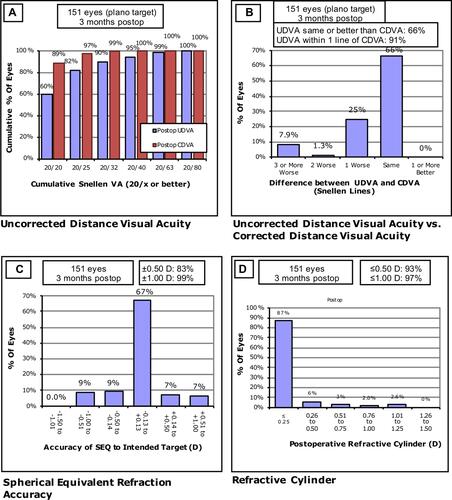
Table 2 Postoperative Refractive Outcomes