Figures & data
Table 1 Description of the Shaffer Grading System
Figure 1 (A) An AS-OCT image of the iridocorneal angle measured using AOD-SL, which can vary depending on the visibility of the image, identification of multiple landmarks, and slope of the curvature post Schwalbe’s line, (B) and the AS-OCT angle width measurement, the diameter of the largest circle that would fit between Schwalbe’s line and iris.
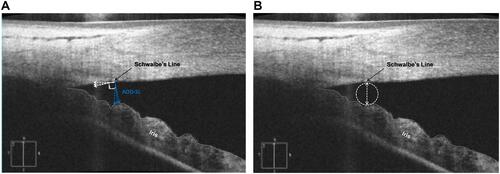
Table 2 Equations Used to Determine Sensitivity, PPV, and NPV
Table 3 Example of the 2×2 Table
Table 4 Patient Characteristics of the Pooled Study Population with at Least 1 Goniometric Measurement and Anterior Segment Optical Coherence Tomography
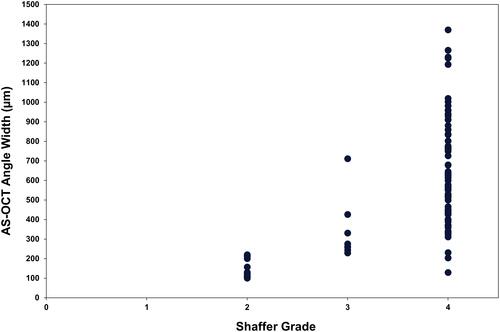
Table 5 The Range (Min, Max), Median, Mean (SD), and Number of AS-OCT Angle Width Measurements in Each Shaffer Grade from the Pooled Study
Table 6 The Sensitivity, PPV, and NPV at Different AS-OCT Angle Width Measurements (µm) Corresponding to Shaffer Grade ≥3
Figure 2 AS-OCT angle width measurements (µm) vs Shaffer Grade (2x2 table). Visualization of TP, TN, FP, and FN when the AS-OCT angle width measurement 300 µm corresponds to Shaffer Grade ≥3. Table overlayed on a visualization of the distribution of the AS-OCT angle width measurements in each Shaffer grade in the pooled study.
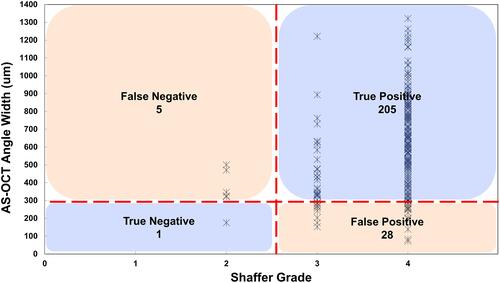
Table 7 Distribution (Percentage) of Shaffer Grade by Quadrant in the Single-Center Study
Table 8 The Median, and Mean (SD) AS-OCT Angle Width Measurements for Each Shaffer Grade by Each Quadrant in the Single-Center Study
Figure 3 A visualization of the distribution of the AS-OCT angle width measurements in each Shaffer grade in the single-center study.