Figures & data
Figure 1 Average corneal thickness values for session one before, 2 minutes after, and 5 minutes after the instillations of polyvinyl alcohol (0.5%), tetracaine hydrochloride (0.5%), and oxybuprocaine hydrochloride (0.4%).
Abbreviation: ANOVA, analysis of variance.
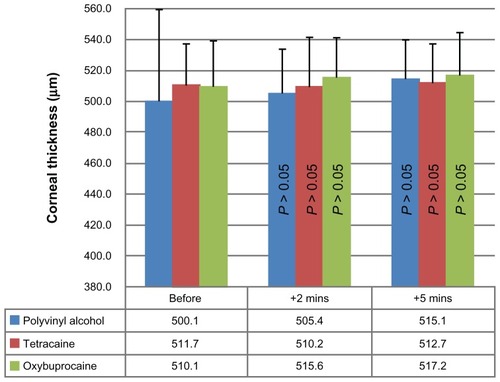
Figure 2 Average corneal hysteresis values for session one before, 2 minutes after, and 5 minutes after the instillations of polyvinyl alcohol (0.5%), tetracaine hydrochloride (0.5%), and oxybuprocaine hydrochloride (0.4%).
Abbreviation: ANOVA, analysis of variance.
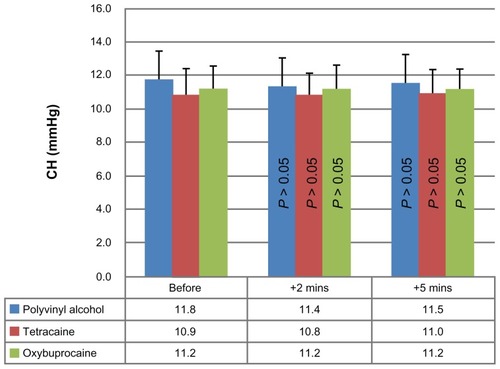
Figure 3 Average corneal resistance factor values for session one before, 2 minutes after, and 5 minutes after the instillations of polyvinyl alcohol (0.5%), tetracaine hydrochloride (0.5%), and oxybuprocaine hydrochloride (0.4%).
Abbreviation: ANOVA, analysis of variance.
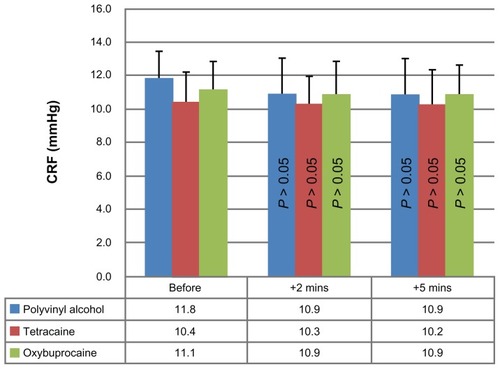
Table 1 Demographic Data of the Subjects
Figure 4 Average Goldmann-correlated IOP values for session one before, 2 minutes after, and 5 minutes after the instillations of polyvinyl alcohol (0.5%), tetracaine hydrochloride (0.5%), and oxybuprocaine hydrochloride (0.4%).
Abbreviations: ANOVA, analysis of variance; IOP, intraocular pressure.
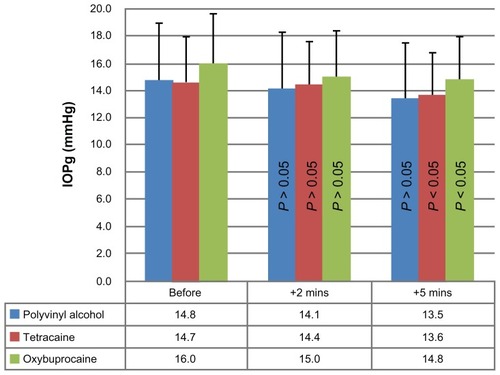
Figure 5 Average corneal-compensated IOP values for session one before, 2 minutes after, and 5 minutes after the instillations of polyvinyl alcohol (0.5%), tetracaine hydrochloride (0.5%), and oxybuprocaine hydrochloride (0.4%).
Abbreviations: ANOVA, analysis of variance; IOP, intraocular pressure.
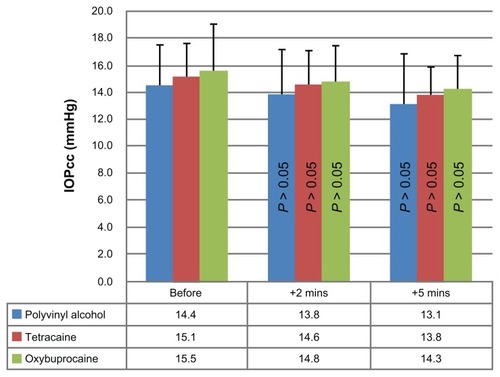
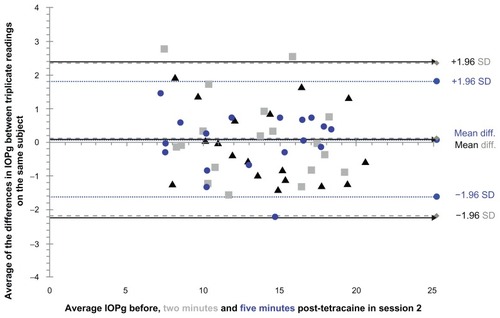
Figure 6 Limits of repeatability for the Goldmann-correlated IOP before (solid black lines with arrow heads), 2 minutes post-instillation (dotted gray lines with diamond heads), and 5 minutes post instillation (dotted lines with round heads) of tetracaine hydrochloride (0.5%) in session 1.
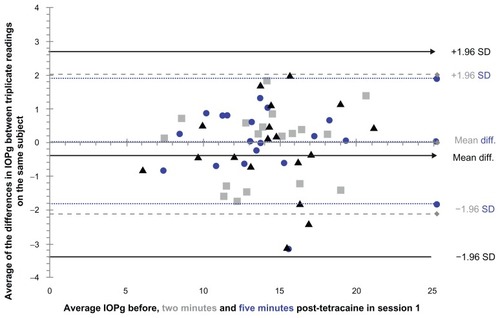
Figure 7 Limits of repeatability for the Goldmann-correlated IOP before (solid black lines with arrow heads), 2 minutes post instillation (dotted gray lines with diamond heads), and 5 minutes post instillation (dotted lines with round heads) of tetracaine hydrochloride (0.5%) in session 2.