
Figures & data
Figure 1 Distribution of patients included in the study.
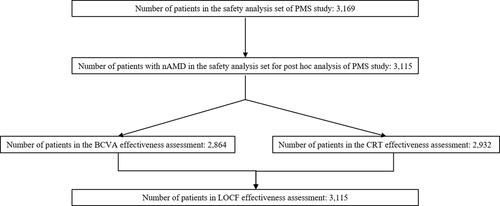
Table 1 Baseline Patient Demographics and Disease Characteristics
Table 2 Treatment Exposure Over 8 Months
Figure 2 BCVA and CRT over 8 months. (A) BCVA (logMAR), (B) CRT (µm).
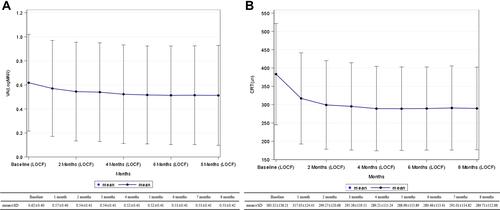
Figure 3 Proportion of patients with vision outcome (3 categories) compared to baseline.
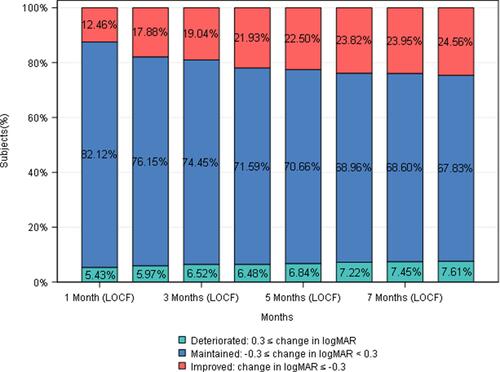
Figure 4 Mean change of BCVA and CRT depending on initial monthly dosing status (whether patients received three initial injections given at intervals of 1 month ± 14 days). (A) Mean change of BCVA depending on initial monthly dosing status. (B) The mean change of CRT depending on the initial monthly dosing status. *P < 0.05.
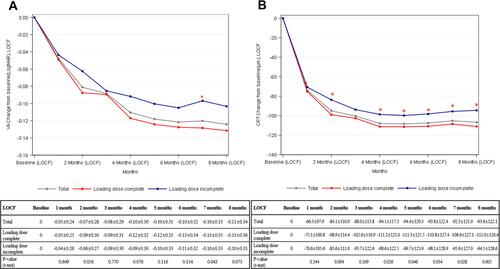
Figure 5 Mean change of BCVA and CRT depending on subtypes of nAMD. (A) The mean change of BCVA depending on subtypes of nAMD (PCV vs non-PCV). (B) the mean change of CRT depending on subtypes of nAMD (PCV vs non-PCV). *P < 0.001, **P < 0.05.
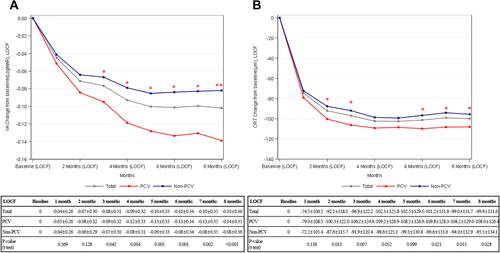
Table 3 Multivariate Regression Analysis Associated with BCVA and CRT Outcome at 8 Months