Figures & data
Table 1 Group characteristics
Table 2 Data preoperatively and at 12 and 24 months
Figure 1 Intraocular pressure development during follow-up for both groups.
Notes: Highly significant reduction in postoperative intraocular pressure was obtained at each visit in both groups (P < 0.0001). Intraocular pressure was not statistically significant between the groups during follow-up. The plot illustrates mean values as the center and standard deviation as the upper and lower lines.
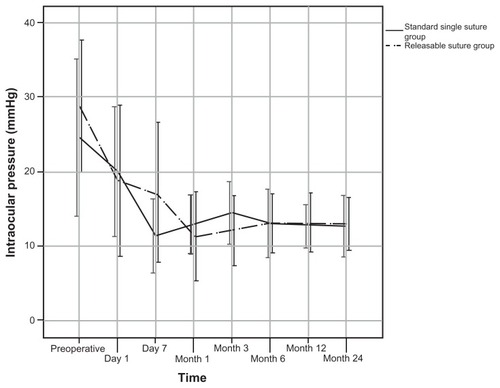
Figure 2 Scatter plot of intraocular pressure results at 12 months postoperatively compared with baseline for each eye.
Notes: Eyes above the oblique line have a higher postoperative intraocular pressure at 12 months compared with preoperative values. Additionally, points falling below the line labeled with 21 mmHg or 18 mmHg have fulfilled both criteria for success with and without glaucoma medication (qualified success).
Abbreviations: IOP, intraocular pressure.
Abbreviations: IOP, intraocular pressure.
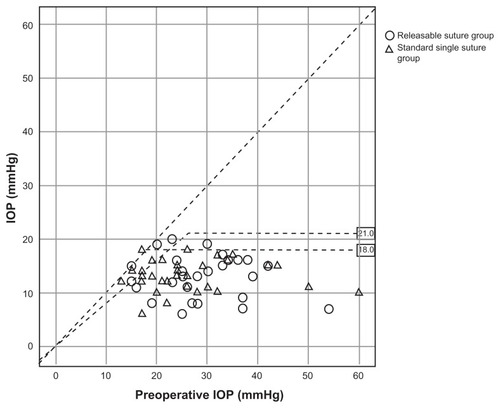
Figure 3 Probability of complete success at months 6 and 12 and at the last visit. (A) Intraocular pressure < 18 mmHg without glaucoma medication. (B) Intraocular pressure ≤ 21 mmHg and at least 20% intraocular pressure reduction without glaucoma medication.
Abbreviations: IOP, intraocular pressure.
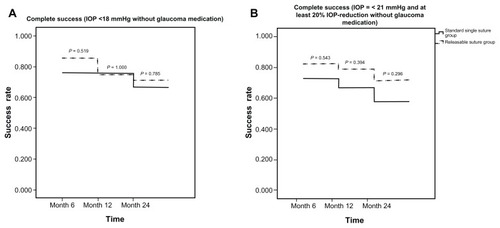
Table 3 Suture and bleb interventions
Table 4 Incidence of postoperative complications
Table 5 Postsurgical interventions