
Figures & data
Figure 1 Schematic of the study design. Randomization (1:1) was stratified at each site by the baseline BCVA in the study eye (34–49 letters vs 50–70 letters). DEX was administered intravitreally every 5 months with a 22-gauge single-use applicator. Laser photocoagulation was administered on Day 1, with retreatment administered if the investigator judged that the patient might benefit and the CRT was ≥300 μm on Spectralis OCT, ≥275 μm on Cirrus OCT, or ≥250 μm on Stratus III OCT.
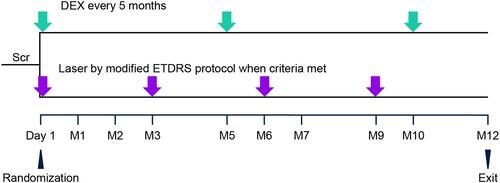
Table 1 Baseline Patient and Study Eye Characteristics (mITT Population)
Figure 2 Mean average change in BCVA from baseline over 12 months (primary endpoint) in the total study population and the Chinese patient subgroup. Values shown are least squares means ± standard errors from an analysis of covariance model using observed values in the mITT population with treatment group as the main effect and baseline BCVA as the covariate.
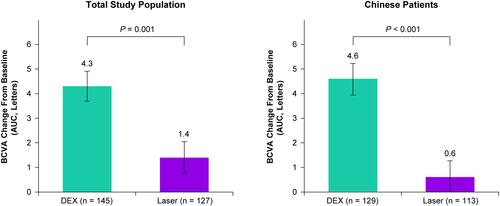
Figure 3 Mean change in BCVA from baseline in the total study population and the Chinese patient subgroup. Values shown are least squares means ± standard errors from a mixed-effects model for repeated measures that used observed values in an unstructured covariance matrix and fixed covariates of treatment group, baseline BCVA, visit, visit-by-baseline BCVA interaction, and treatment-by-visit interaction. *P ≤ 0.036 vs laser.
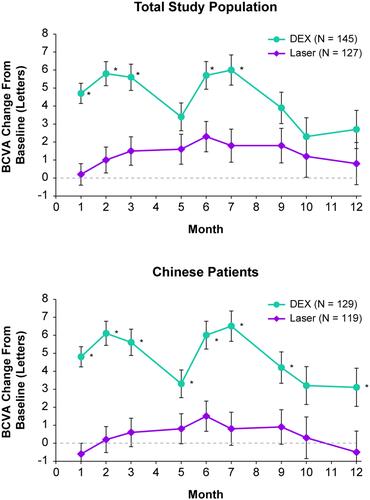
Figure 4 Mean change from baseline in CRT at Month 12 in the total study population and the Chinese patient subgroup. Values shown are least squares means ± standard errors from an analysis of covariance model in the mITT population using LOCF for missing values with treatment group and baseline BCVA categories as main effects and baseline CRT as the covariate.
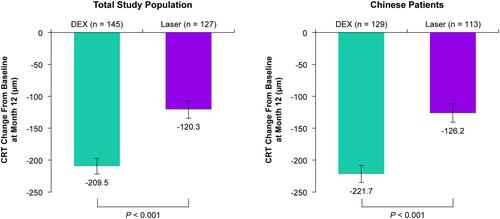
Figure 5 Mean change from baseline in the total leakage area at Month 12 in the total study population and the Chinese patient subgroup. Values shown are least squares means ± standard errors from an analysis of covariance model in the mITT population using LOCF for missing values with treatment group and baseline BCVA categories as main effects and baseline total leakage area as the covariate.
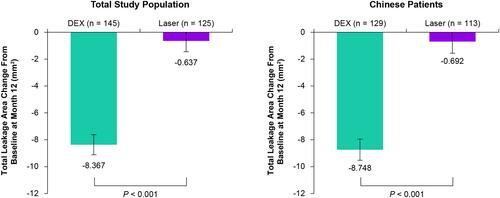
Table 2 Treatment-Emergent AEs in Study Eyes (Safety Population)
Table 3 IOP Safety Parameters in Study Eyes (Safety Population)