Figures & data
Table 1 Lighting Benefit Metrics
Figure 1 Layout of experimental facility room (dimmable luminaires, illuminance meter, visual acuity chart, lighting control system, etc.).
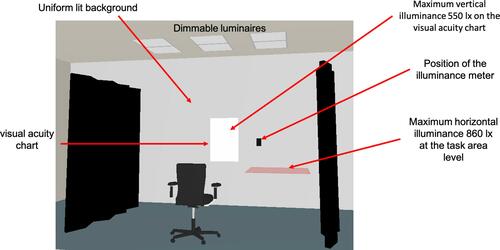
Figure 2 Illumination distribution according to RELUX simulation tool.
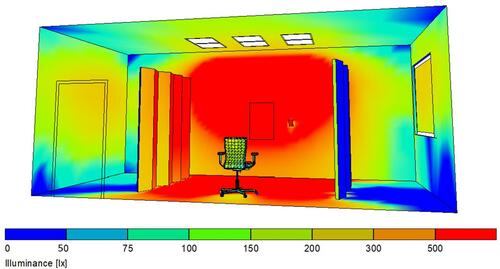
Figure 3 Relative luminous efficiency functions. V(λ) is the original photopic luminous efficiency function. VPanoptix(λ) is the modified photopic luminous efficiency function for pseudophakic eyes implanted with Panoptix IOLs. Vpanoptix(λ) lower values = V(λ) for the lower transmittance values for the distant focal point of Panoptix IOL. Vpanoptix(λ) upper values = V(λ) for the upper transmittance values for the distant focal point of Panoptix IOL.
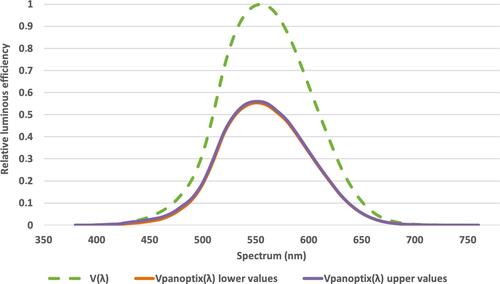
Figure 4 Τhe spectral transmittance values for the distant focal point of Panoptix IOL in comparison with a 53-year-old crystalline lens. Vpanoptix(λ) lower values = V(λ) for the lower transmittance values for the distant focal point of Panoptix IOL. Vpanoptix(λ) upper values = V(λ) for the upper transmittance values for the distant focal point of Panoptix IOL.
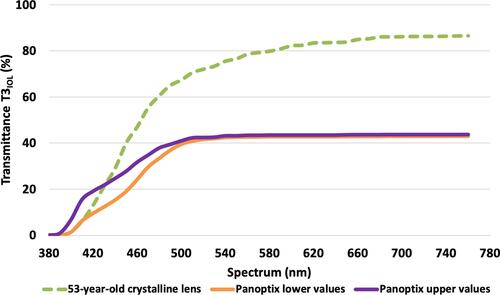
Table 2 ICIRPanoptix Values for Selected Lighting Sources
Figure 5 Actual relative spectral radiant flux emitted from the selected light sources.
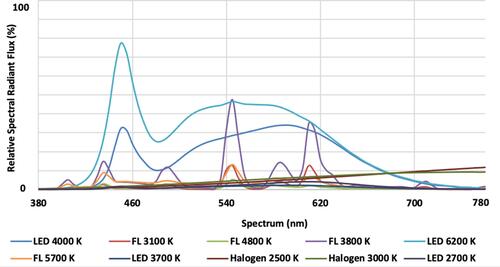
Table 3 Demographic and Clinical Characteristics of Study Participants
Table 4 Differences in Uncorrected Distance Visual Acuity and Minimum Required Illuminance Level
Table 5 Experimental Measurements for Different Illuminance Levels
Figure 6 Percentile UDVA for study and control group at different illuminance levels. .
.
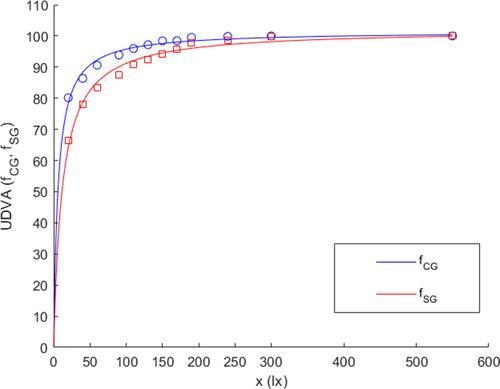
Table 6 Necessary Illuminance for Equal Percentile UDVA
Figure 7 Necessary additional illuminance of study group for equal percentile UDVA with control group (xSGeq - x) for different illuminance levels. , where γ = (100–2.4) %.
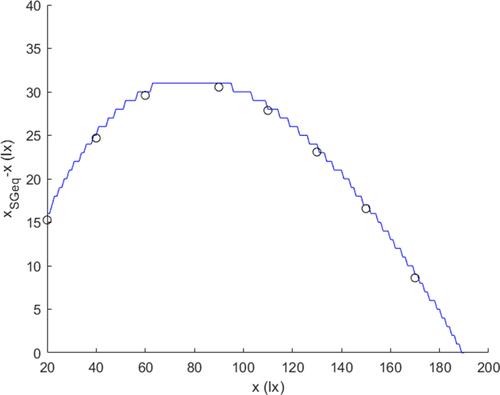
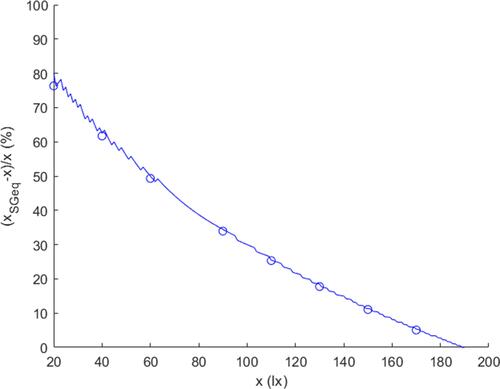
Figure 8 Additional percentile illuminance (xSGeq - x)/x needed in study group for equal percentile UDVA with control group. , where γ = (100–2.4) %.