Figures & data
Figure 1 Photograph of the apparatus of M-stereotest. (A) A manipulator attached with stainless wires was set under the objective lens of a stereomicroscope. 1: knob, 2: micrometer, 3: stainless wires. (B) Enlarged view of the wire section.
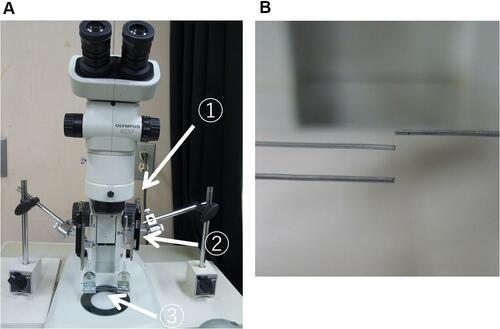
Table 1 The Details of the Measurement Conditions
Table 2 Profile of the Subjects
Figure 2 Deviation by M-stereotest under various conditions. (1) Best optical corrected binocular condition, (2) monocular dominant eye condition, (3) monocular nondominant eye condition, (4) binocular dominant eye −3.0 D condition, (5) binocular dominant eye +3.0 D condition, (6) binocular nondominant eye −3.0 D condition, (7) binocular nondominant eye +3.0 D condition.
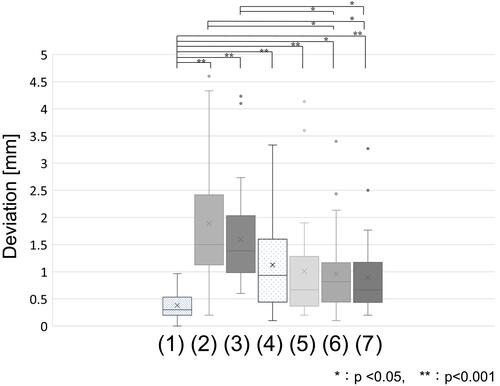
Figure 3 Relationship between the deviation of M-stereotest and eye position at 30 cm (A) and 5 m (B), AC/A ratio (C), the fusional amplitude (D), the amplitude of accommodation (E), and the distance three-rods test (F). Deviation indicates the deviation of M-stereotest under the best optically corrected binocular conditions. There was no correlation between the deviation of M-stereotest and either eye position, AC/A ratio, fusional amplitude, or amplitude of accommodation (A–E); however, significant correlation was observed between the deviation of M-stereotest and the distance three-rods test. (F).
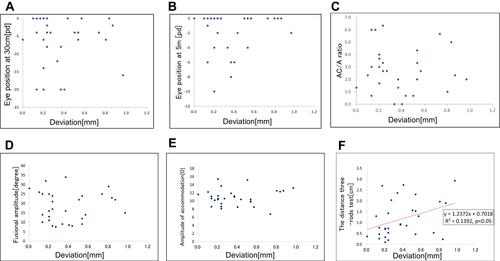
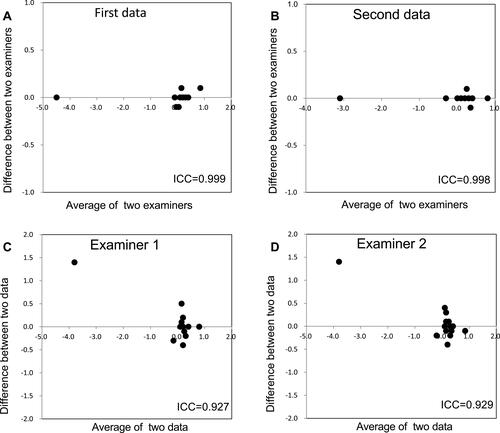
Figure 4 Bland–Altman analysis. (A) Reliability between examiners in the first data. (B) Reliability between examiners in the second data. (C) Reproducibility of the data measured by examiner 1. (D) Reproducibility of the data measured by examiner 2. For any 15 subjects, the M-stereotest with binocular best optically corrected correction was measured by the same examiner and then a different examiner. Each intraclass correlation coefficients (ICC) was high. Therefore, the reliability between the examiners and the reproducibility of the data in the M-stereotest were confirmed.