Figures & data
Table 1 Results of the COVID-19 Survey Scale Among Up to 685 Ophthalmologists
Table 2 Patients Seen Before the Pandemic (Categories: 1: <50; 2: 50–100; 3: 101–150; 4: 151–200; 5: >200) and Perceived Mean Reduction Due to the COVID-19 Pandemic Depending on Continent, Gender, Age and Experience
Table 3 Results of Scale of Satisfaction with the Respective Governments of Different Countries (Only Countries with at Least 10 Answers are Shown) and Their Deaths per Million Capita Due to SARS-CoV-2 Infection Cited on the 15th of July 2021 (Source StatistaCitation11); Strongly Agree: 1; Generally Agree: 2 Indifferent: 3; Generally Disagree: 4; Strongly Disagree: 5
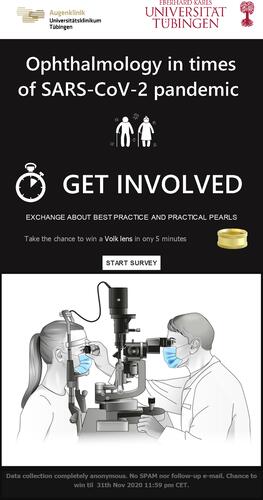
Figure 1 Example view of the responsive email template that invited participation in the survey.