Figures & data
Table 1 Inclusion and exclusion criteria
Table 2 Baseline characteristics of the patients
Figure 1 Twelve-month variation of best corrected visual acuity in patients treated for wet age-related macular degeneration either with bevacizumab or ranibizumab.
Abbreviation: ETDRS, Early Treatment Diabetic Retinopathy Study.
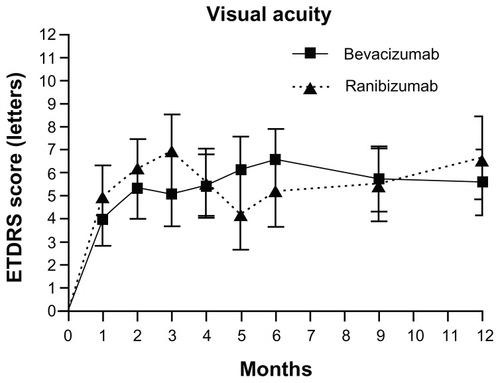
Figure 2 Twelve-month variation in central foveal thickness using OCT in patients treated for wet age-related macular degeneration either with bevacizumab or ranibizumab.
Abbreviation: OCT, ocular coherence tomography.
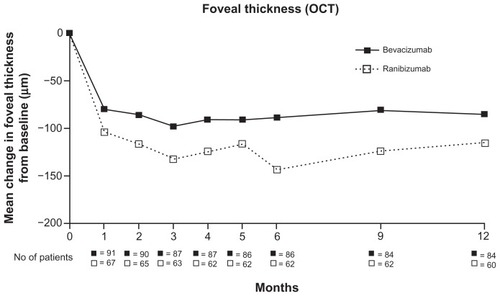
Figure 3 Central foveal thickness measured using OCT throughout 12 months of treatment with either bevacizumab or ranibizumab.
Abbreviation: OCT, ocular coherence tomography.
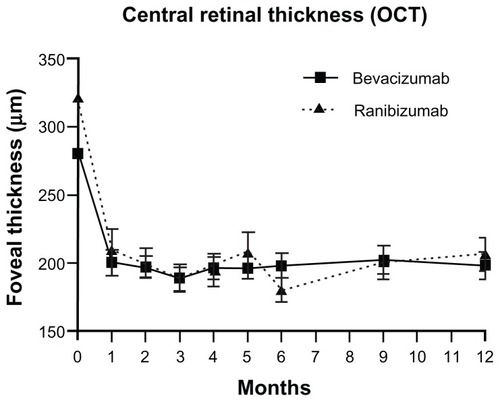
Table 3 Outcome measures at month 12
Table 4 Number of initial consecutive injections to achieve a dry macula