Figures & data
Table 1 Specifications of AT LARA 829MP EDoF IOL
Table 2 Visual and Refractive Outcomes at 1 Week, 1 Month, 3 Months, 6 Months and 12 Months Postoperatively
Figure 1 Histogram showing the accuracy with respect to the intended spherical equivalent refraction at 12 months postoperatively.
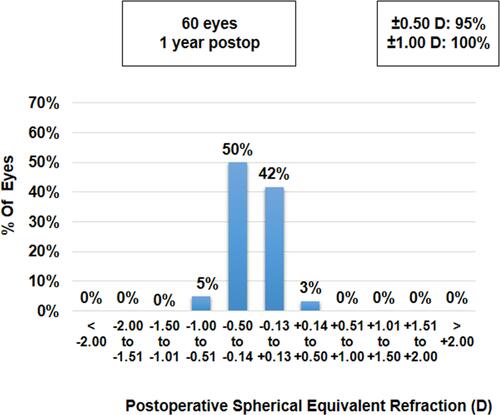
Figure 2 Histogram showing change in refractive astigmatism at 12 months postoperatively.
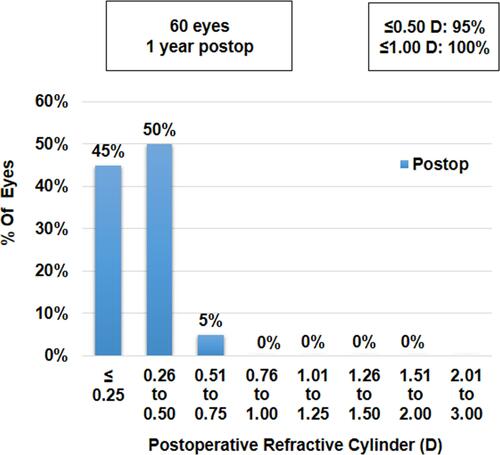
Figure 3 Histogram showing uniocular results for UDVA (n=60 eyes) and CDVA obtained following implantation of AT LARA EDoF IOL at 12 months postoperatively.
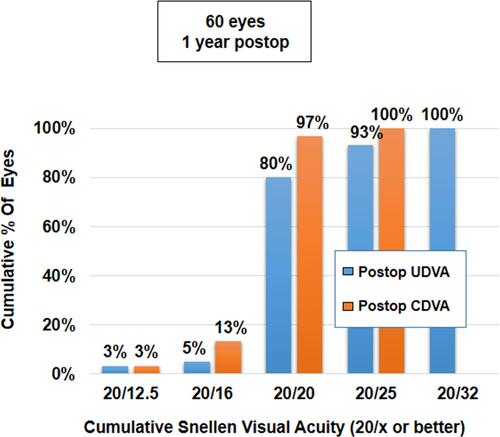
Figure 4 Histogram showing binocular cumulative visual acuity UDVA and CDVA achieved at 12 months postoperatively.
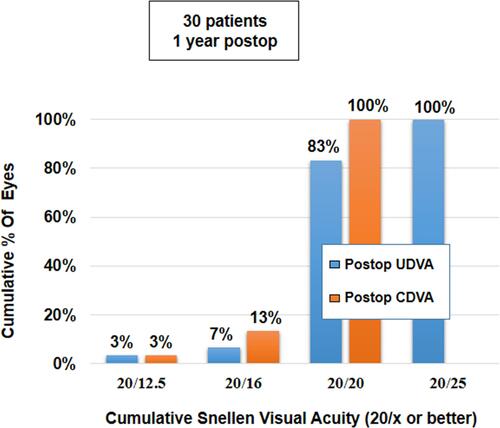
Figure 5 Histogram showing change in Snellen lines of UDVA versus CDVA at 12 months postoperatively.
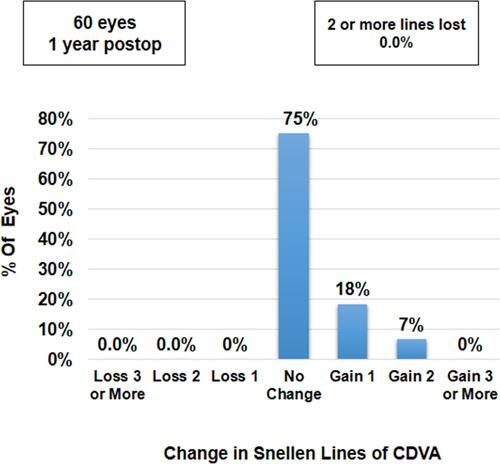
Figure 6 Histogram showing binocular uncorrected near vision results at 12 months postoperatively.
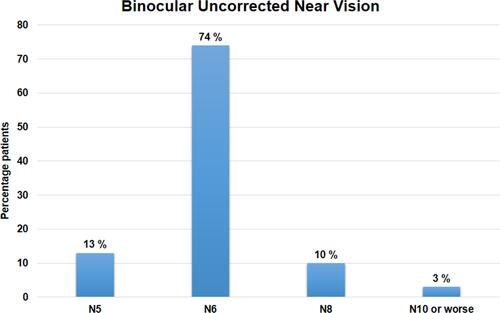
Table 3 Intermediate Visual Acuity with ETDRS Charts and Reading Speeds at 40, 60 and 80 cm and Contrast Sensitivity with CSV-1000 at Postoperative Visits from 1 Week to 12 Months
Figure 7 Photopic contrast sensitivity evaluated binocularly (with correction) at 12 months.
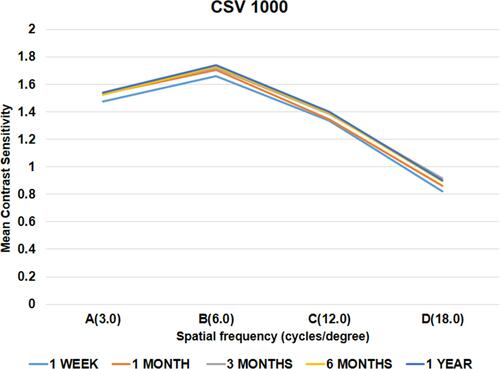
Figure 8 Binocular distance corrected defocus curve evaluated from +2 to −3 D defocus at 12 months.
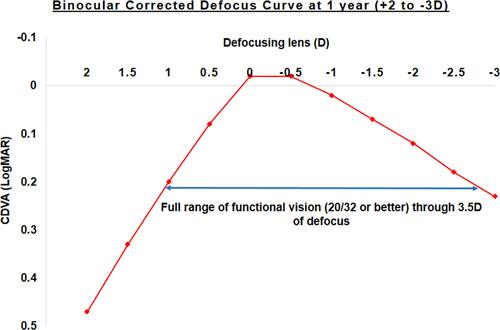
Figure 9 Histogram showing spectacle independence (% of patients) for activities performed at different distances.
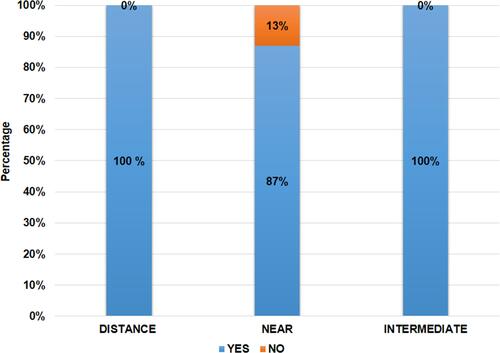
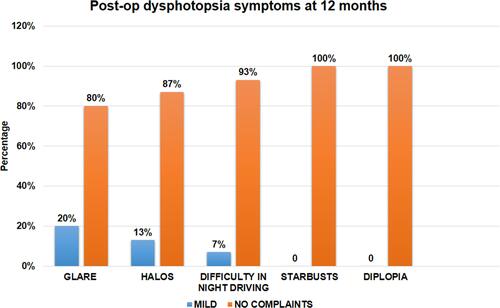
Figure 10 Histogram showing distribution of postoperative dysphotopsia symptoms.