
Figures & data
Table 1 Mean Speed Score by OSDI Categorization
Table 2 Cronbach’s Alpha of OSDI Questionnaire and Its Sub-Sections
Table 3 Cronbach’s Alpha of SPEED Questionnaire and Its Sub-Sections
Figure 1 Scatter plot of OSDI against SPEED scores.
Abbreviations: SPEED, standard patient evaluation of eye dryness; OSDI, ocular surface disease index.
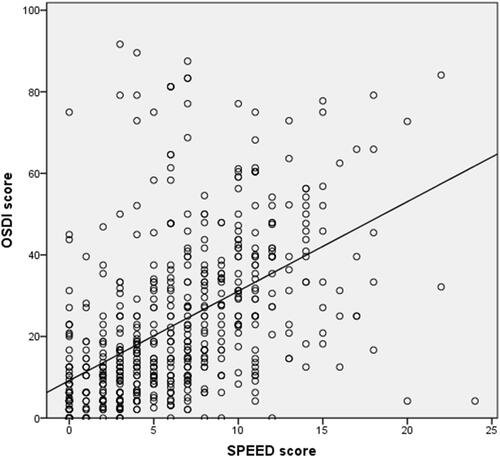
Table 4 Cutoff Values for SPEED
Figure 2 Area under the curve for SPEED.
Abbreviation: OSDI, ocular surface disease index.
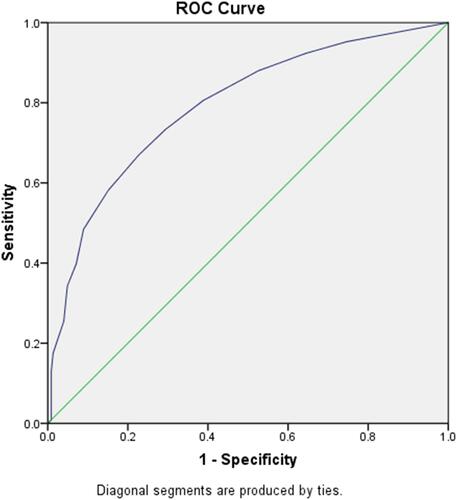
Table 5 Cohen’s Kappa with Various SPEED Cutoff Values