Figures & data
Figure 1 Vertical (A) and horizontal (B) single line image obtained with optical coherence tomography (OCT) instrument, the foveal pit as manually marked in the custom-written software (straight red line in (A and B), the anterior (green line in (A and B) and posterior (blue line in (A and B) are the boundaries of the choroid.
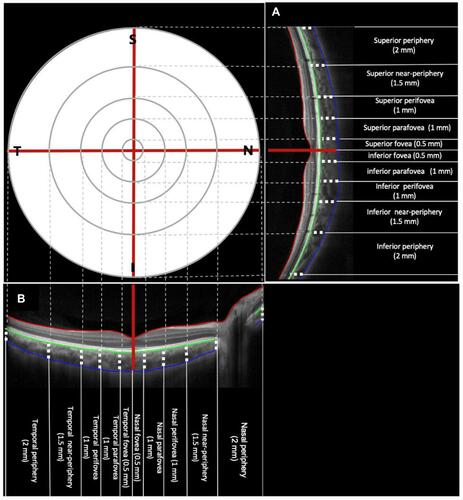
Table 1 Participant Demographic Data and Ocular Characteristics
Table 2 Overview of Mean Choroidal Thickness Across Measured Regions
Figure 2 Mean choroidal thickness (μm) a across different quadrants as a function of eccentricity in emmetropic (A), myopic (B), and high myopic eyes (C). Error bars represents standard error of the mean. Single asterisks (*) indicate a statistically significant difference (p < 0.05) between the superior and the other quadrants. Filled symbols represent a statistically significant difference (p < 0.05) in a given choroidal eccentricity compared to the adjacent eccentricity to the left.
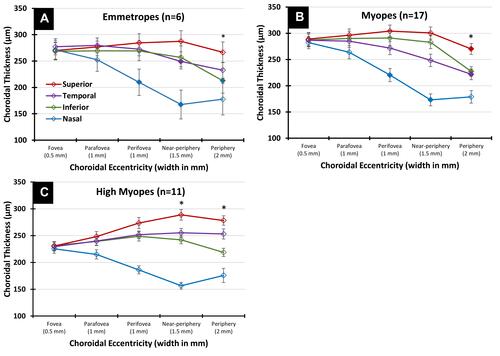
Table 3 Overview of the Diurnal Variation Amplitude in Axial Length and Choroidal Thickness in the Three Myopic Refractive Groups
Figure 3 Mean change in subfoveal choroidal thickness (ChT) and axial length (AL) among the three refractive groups. Error bars represent standard error of the mean.
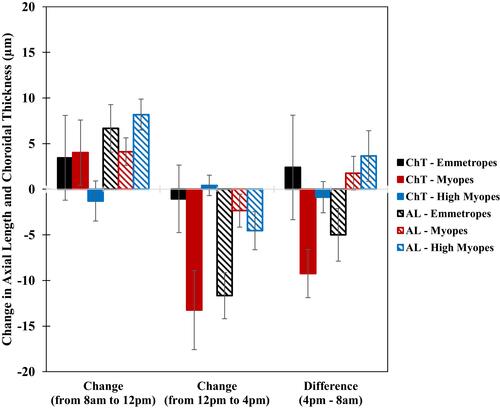
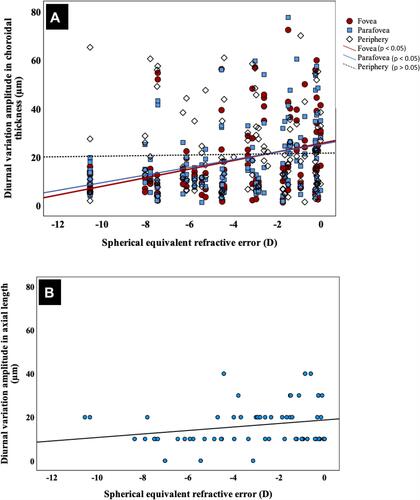
Figure 4 Scatter plots graphs illustrating the association between the diurnal variation amplitude in choroidal thickness and refraction (A) and between the variation in axial length and refraction (B).