Figures & data
Table 1 Bibliometric Profiles of Ophthalmology and Vision Science Faculty in Canada
Figure 1 Average H-indices for ophthalmologists (A) and vision scientists (B) stratified by sex and rank.
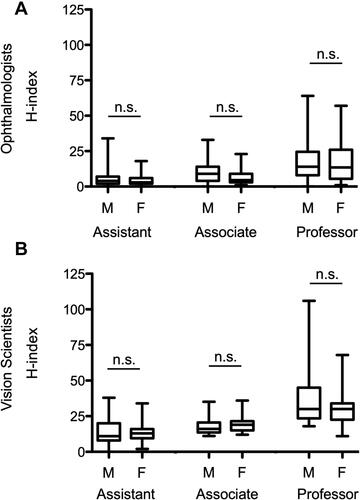
Table 2 Sex Distribution of Clinical Ophthalmologists and Vision Scientists with Bibliometric Profiles Appointed at Accredited Canadian Academic Institutions
Figure 2 Average year of first publication for (A) ophthalmologists and (B) vision scientists, stratified by sex (***P < 0.001, *P < 0.05, Student’s t-test).
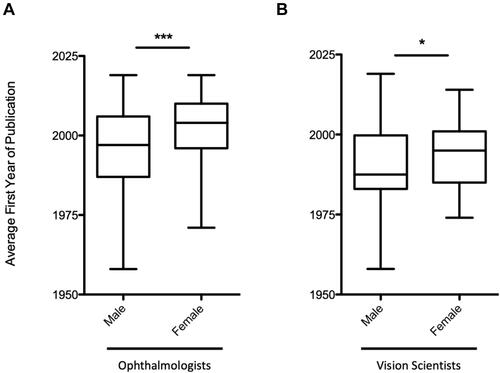
Figure 3 Average H-indices by rank for (A) ophthalmologists and (B) vision scientists; and average m-quotients by rank for (C) ophthalmologists and (D) vision scientists. Groups with the same letter were not significantly different from one another (p<0.05, Kruskal Wallis test).
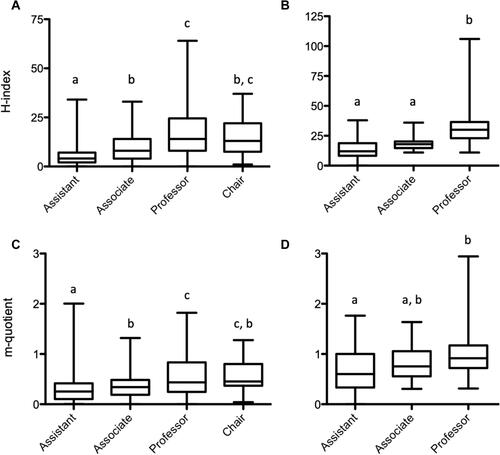
Figure 4 Average H-index by degree for (A) ophthalmologists and (B) vision scientists. (*** P<0.0001, Student’s t-test. Groups with the same letter were not significantly different from one another (p<0.05, Kruskal–Wallis test)).
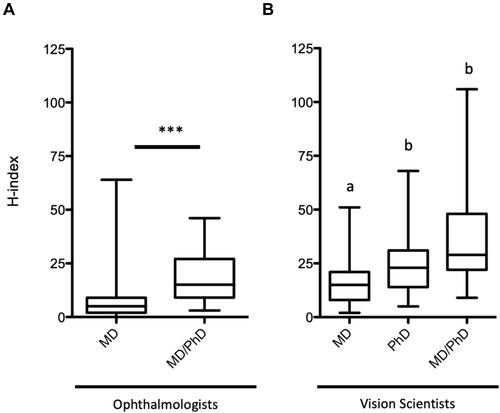
Figure 5 (A) The number of ophthalmologists per subspecialty in Canada, and (B) average H-indices of members in each subspeciality (***P < 0.001 against General/Comprehensive, Dunn’s Multiple Comparison Tests).
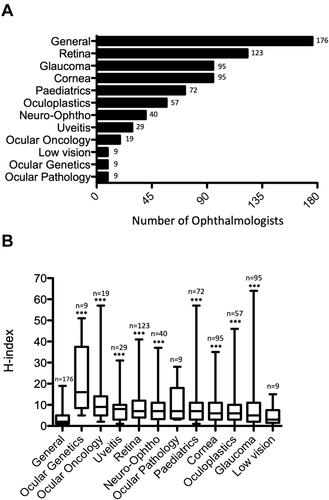
Figure 6 Comparison of average H-indices for (A) Canadian researchers (2020), and (B) American ophthalmologists (2016).9.
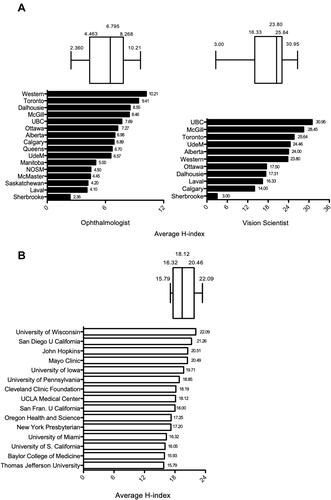
Figure 7 (A) Average m-quotients by institution, (B) career longevity of institutional faculty members as indicated by average first year of publication, and (C) research productivity as a function of career longevity.
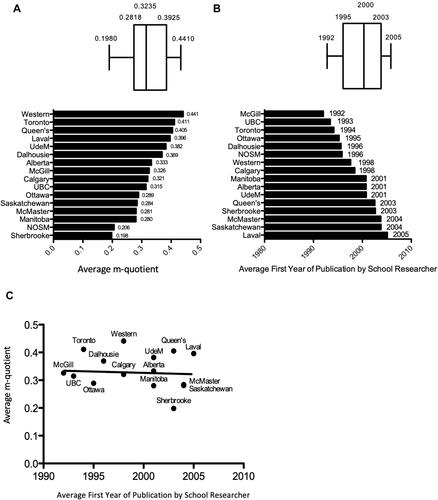
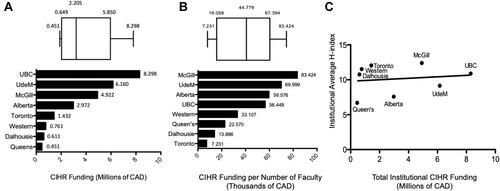
Figure 8 Canadian Institutes of Health Research (CIHR) funding: (A) total funding per school, (B) institutional funding per number of faculty, and (C) average institutional H-index as a function of CIHR funding.