
Figures & data
Table 1 Baseline Demographics
Table 2 Postoperative Mean UDVA (logMAR)
Figure 1 Patients 20/20 or better and 20/40 or better at 1 week, 3 months, and 1 year postoperatively. (A and B) Uncorrected distance visual acuity (UDVA) of 20/20 or better and 20/40 or better for PCS (A) and FLACS (B) patients preoperatively, 1 week, 3 months, and 1 year. Patients with target refractions not set to 0 D were removed. C-D: Best distance visual acuity (BDVA) of 20/20 or better and 20/40 or better for PCS (C) and FLACS (D) patients preoperatively, 1 week, 3 months, and 1 year. E-F: Uncorrected near visual acuity (UNVA) of 20/20 or better and 20/40 or better for PCS (E) and FLACS (F) patients preoperatively, 1 week, 3 months, and 1 year. All patients receiving monovision were excluded.
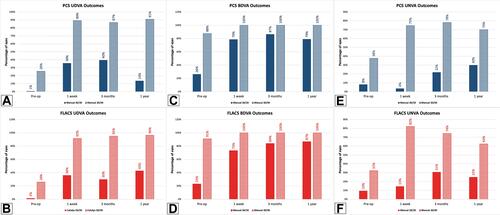
Table 3 Odds Ratio of UDVA
Figure 2 Percentage of patients with BDVA and UDVA of specific visual acuity at 3 months postoperative. (A) Comparison of PCS patients with preoperative BDVA and postoperative UDVA showing the percentage of patients presenting with 20/x visual acuity. All patients with target refractions not set to 0 D were removed from UDVA. (B) Comparison of FLACS patients with preoperative BDVA and postoperative UDVA showing the percentage of patients presenting with 20/x visual acuity. All patients' target refractions not set to 0 D were removed from UDVA.
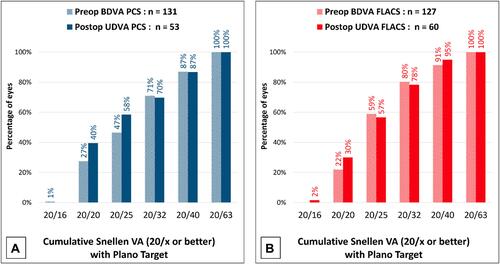
Figure 3 Comparison of Visual Outcomes including Safety, Stability, and Predictability. Comparison of visual acuity in 3 months postoperative UDVA with preoperative BDVA (A). All patients with target refractions not set to 0 D were removed from UDVA. Comparison of postoperative BDVA change in PCS versus FLACS patients (B). Comparison of spherical equivalent refraction accuracy in PCS versus FLACS patients at 3 months postoperative organized by accuracy to the intended target (C). Comparison of stability of spherical refraction in PCS versus FLACS patients at 3 months postoperative (D).
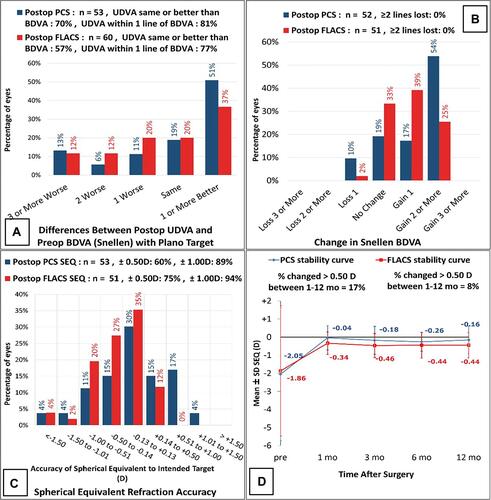
Figure 4 Astigmatic comparison. (A and B) Comparison of pre- and postoperative (3 months) refractive astigmatism in PCS patients (A) and FLACS patients (B). (C) Plot of target versus actual astigmatism in PCS versus FLACS patients at 3 months postoperatively. (D) Comparison of the astigmatic angle of error in PCS versus FLACS patients at 3 months postoperative.
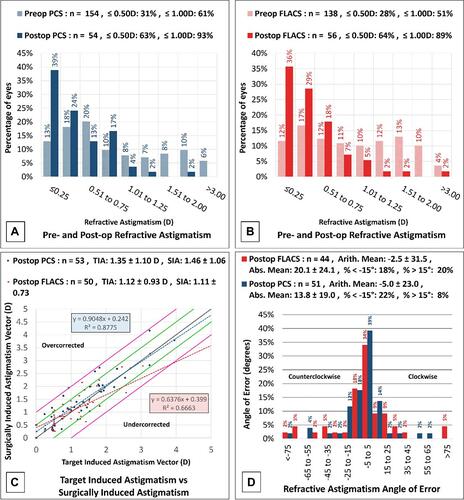
Figure 5 Postoperative Refractive Astigmatism. Pre- and postoperative comparison of refractive astigmatism with the percentage of eyes in PCS (A) and FLACS (B).
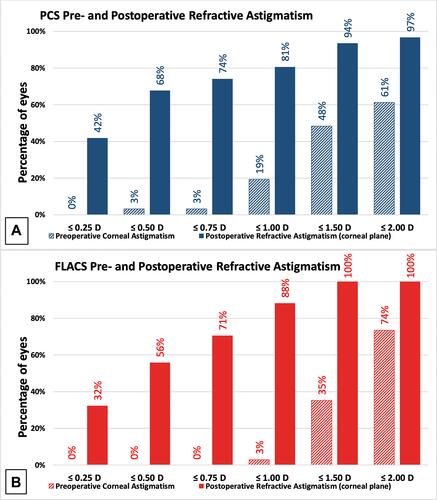
Figure 6 Vector Analysis and Prediction Error of Postoperative Refractive Astigmatism. Comparison of mean pre- and postoperative astigmatism in patients undergoing PCS (A) and FLACS (B) showing 95% confidence ellipse of dataset and centroid with an N value of 31. Comparison of postoperative refractive astigmatism prediction error in PCS and FLACS patients (C).
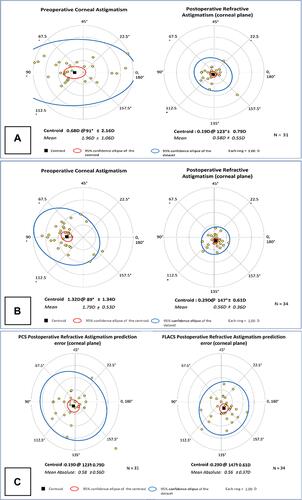
Table 4 Postoperative Patient Complaints and Complications