Figures & data
Figure 1 Numerical Rating Scale used in the COOL-1 study.
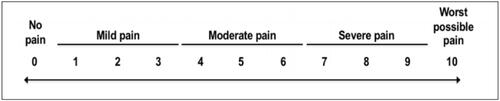
Figure 2 The components of the Cooling Anesthesia Device. (A) The hand-held device, which cools the single-use tips through a high performance thermoelectric cooling module powered by rechargeable batteries. (B) A single-use tip, which includes metal surface delivering the cooling treatment to the conjunctiva for instant anesthetic effect. (C) The battery charging dock, which is used to recharge the device.
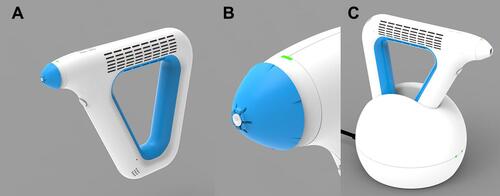
Table 1 COOL-1 Subject Demographics
Table 2 Adverse Events. Parenthesis is Percentage Among All Cooling Applications (n = 43)
Table 3 Comparison of NRS Pain Scores Among Differing Groups
Figure 3 Numerical Rating Scale scores between different cooling treatments. (A) Numerical Rating Scale (NRS) scores at time of injection. Bars are illustrated as mean with 95% confidence intervals as error bars. (B) NRS scores 5 minutes after Injection. Bars are illustrated as mean with 95% confidence intervals as error bars. (C) NRS scores 24–49 hours after injections. Bars are illustrated as mean with 95% confidence intervals as error bars. *P < 0.05 n.s. not statistically significant, as measured by one way ANOVA.
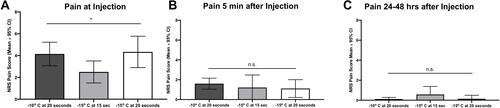
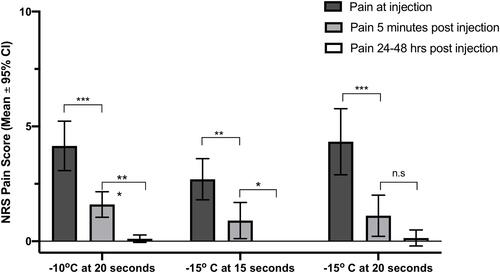
Figure 4 Numerical Rating Scale (NRS) scores over time. NRS scores at time of injection, 5 minutes after injection, and 24–48 hours injection for each group. Bars are illustrated as mean with 95% confidence intervals as error bars. *P < 0.05, **P < 0.01, ***P < 0.001, as measured by paired t-test.